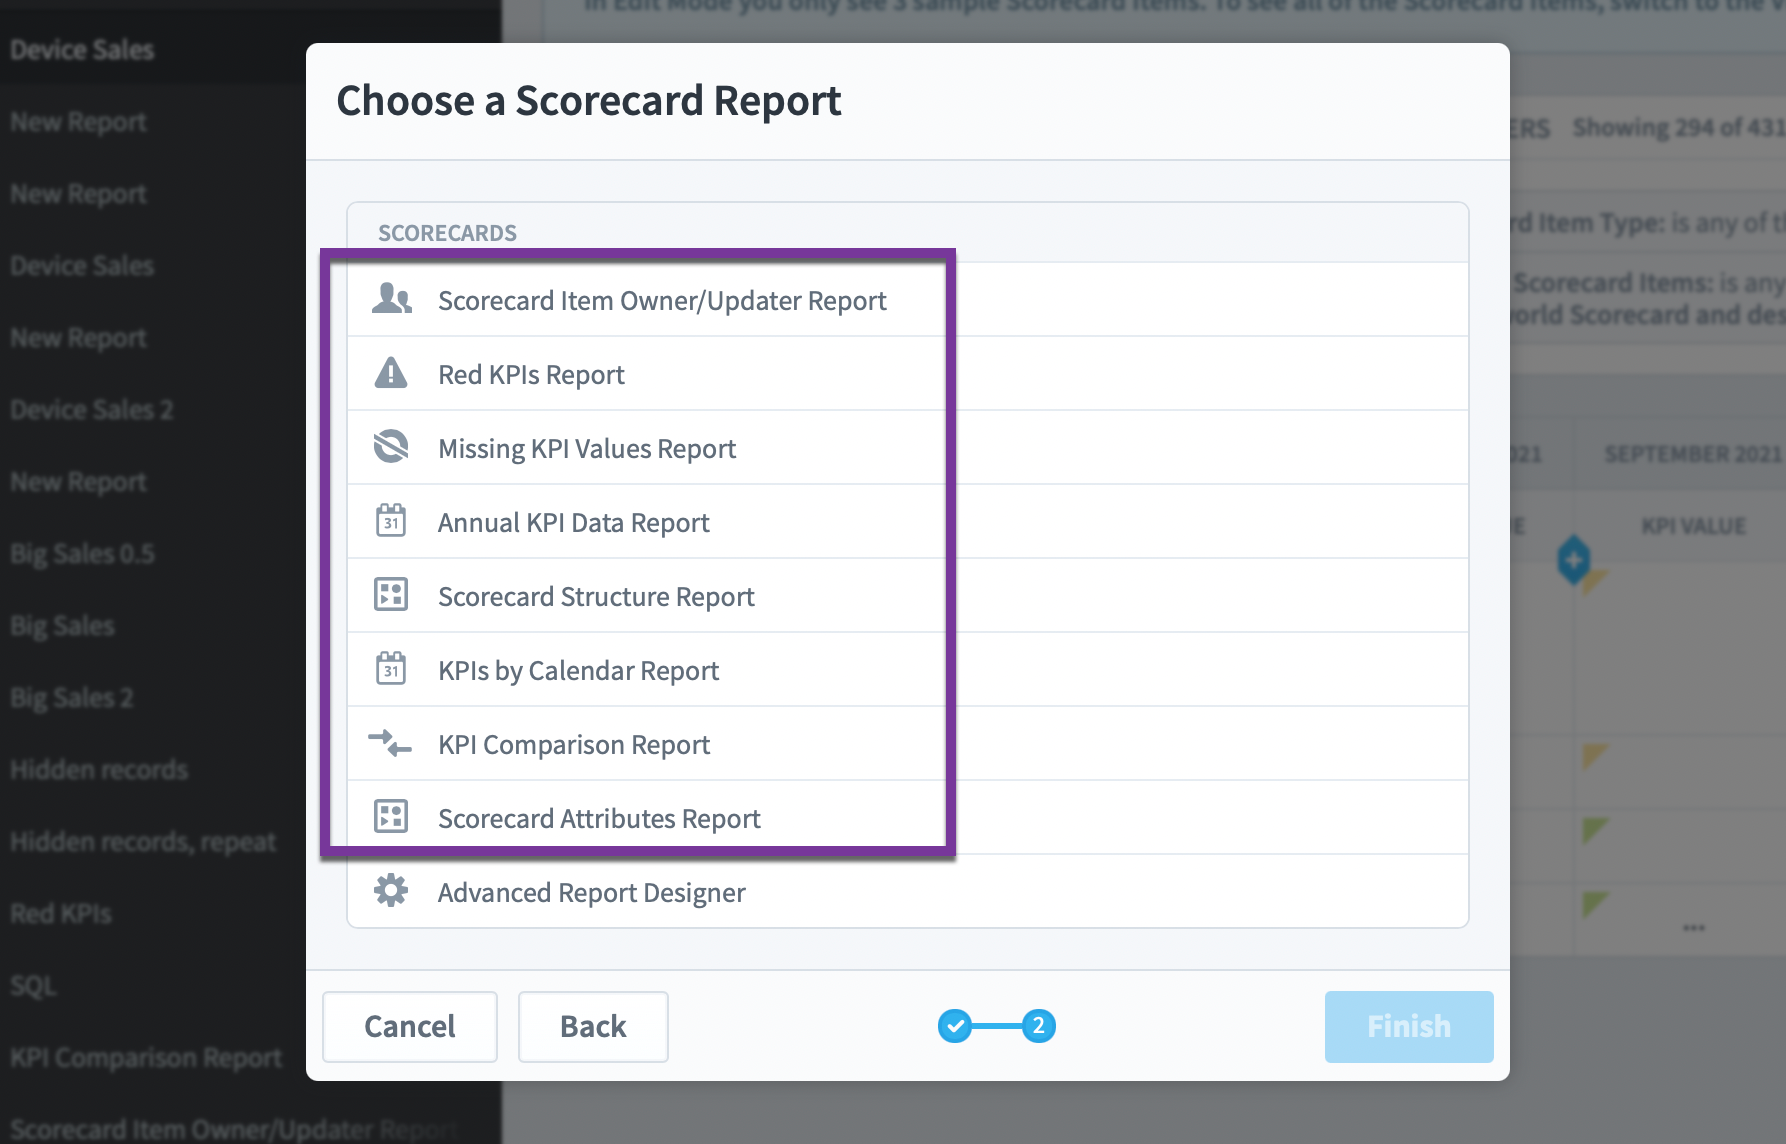
When you choose to create a Scorecard report, the first 8 report options are prebuilt reports to quickly show you relevant data. Most of these "canned" reports are built on top of the Advanced Report Designer and provide you with a great starting point for further customization.
Scorecard Item Owner/Updater Report
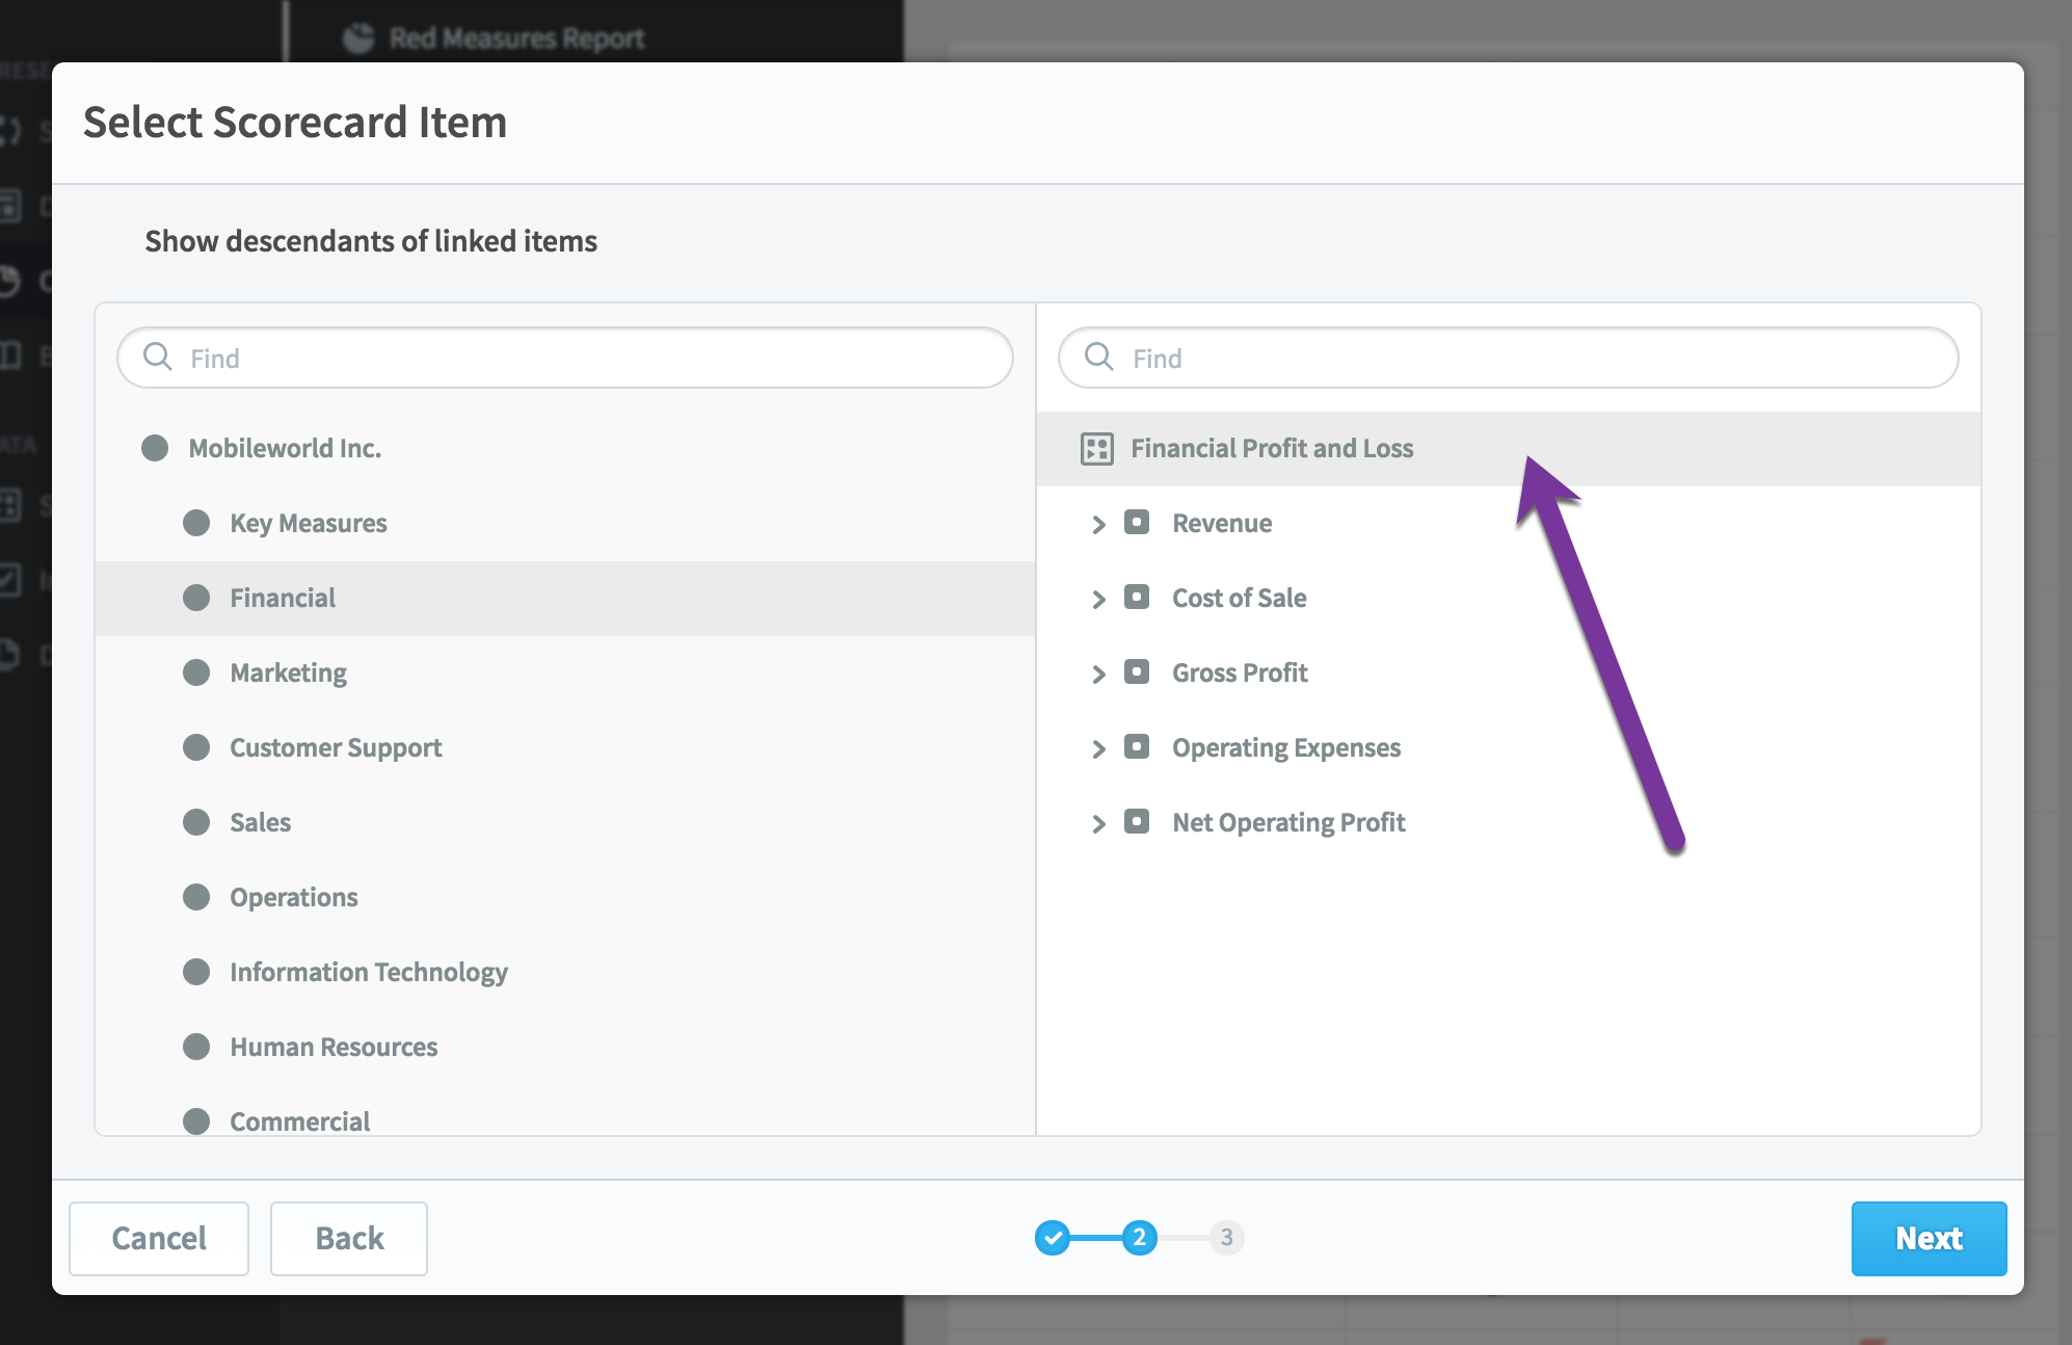
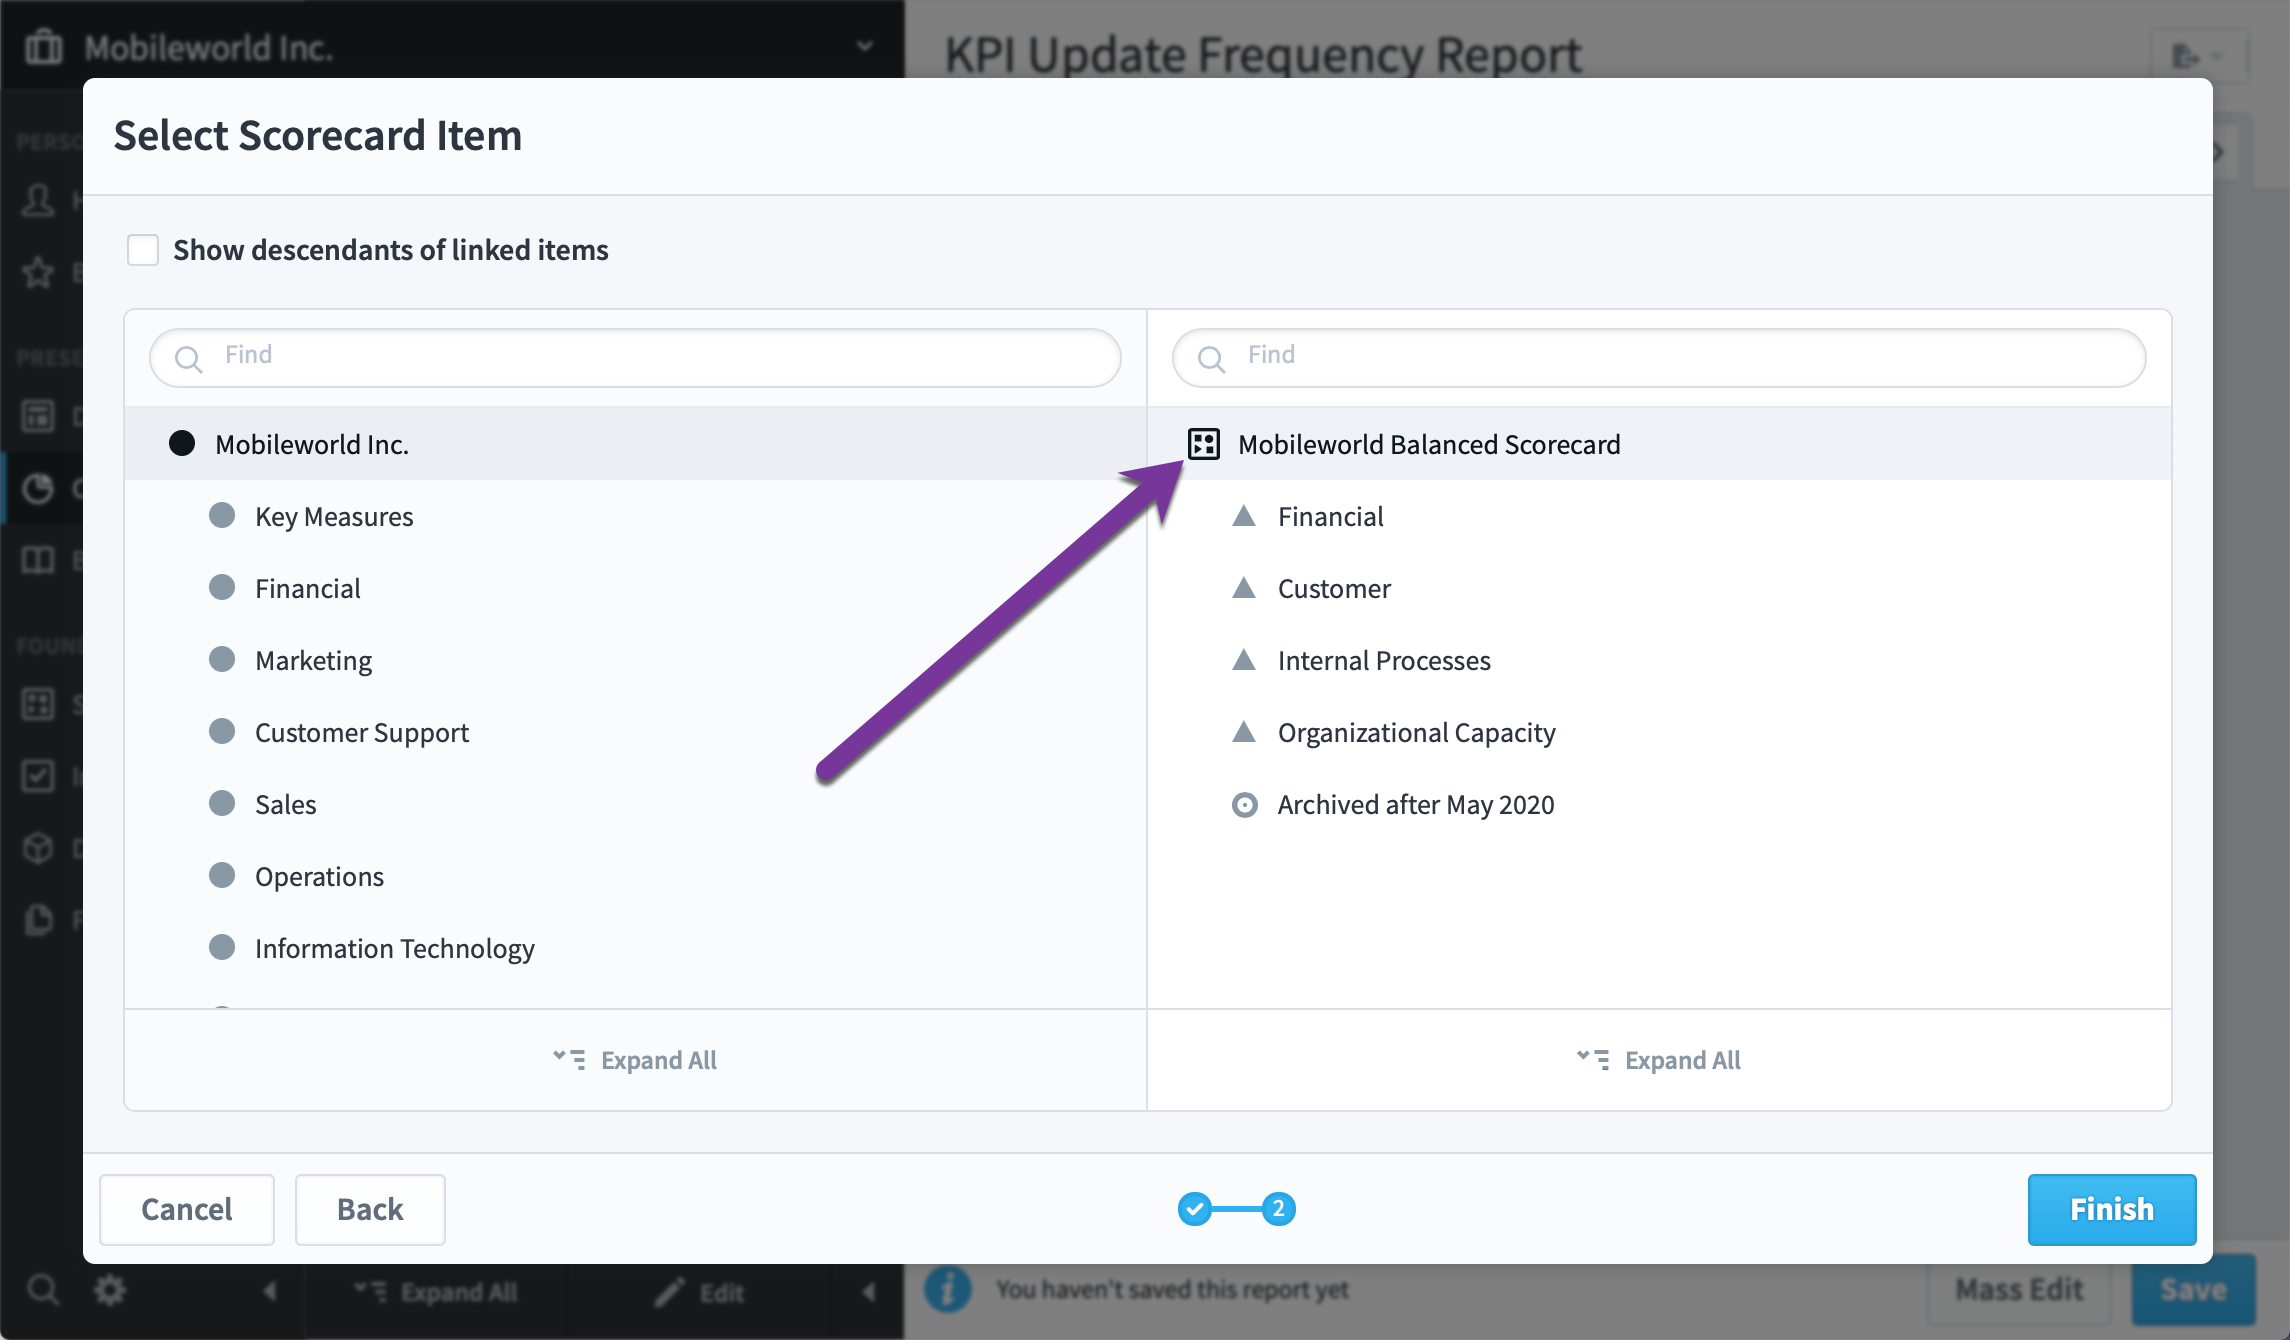
The owner/updater report shows all of the owners and/or updaters for the scorecard items you choose. The first step is to choose a scorecard item, and here we’re choosing an entire scorecard.
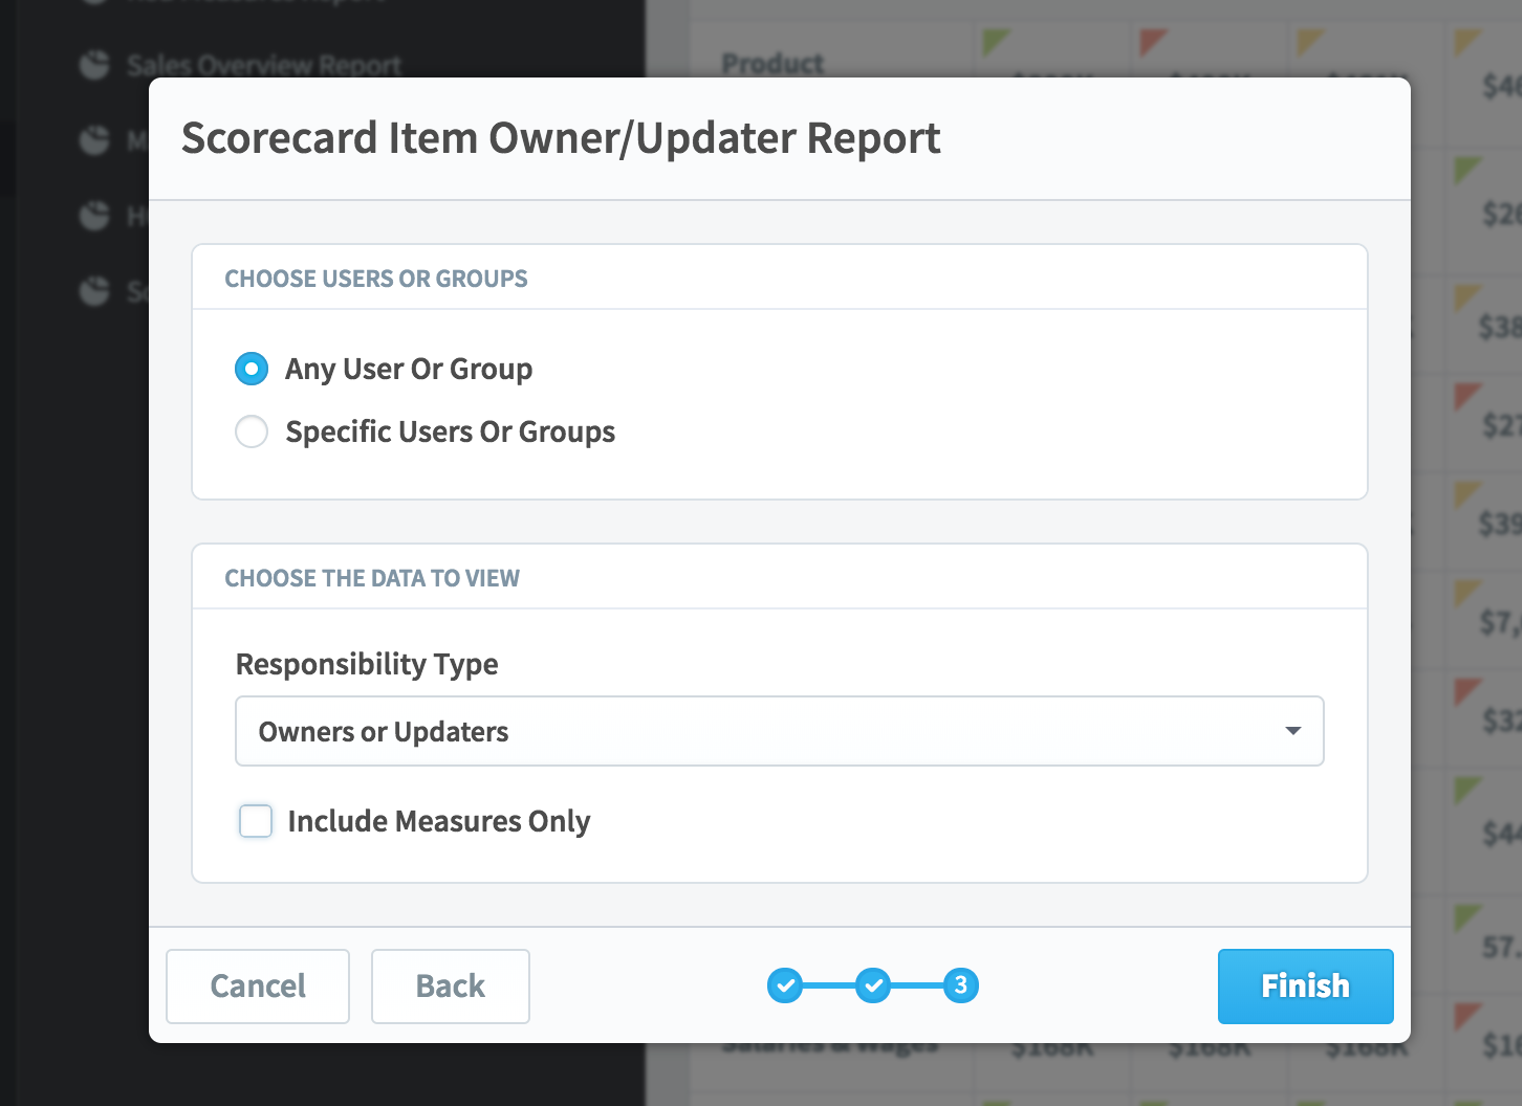
Next you choose what you want the report to show.
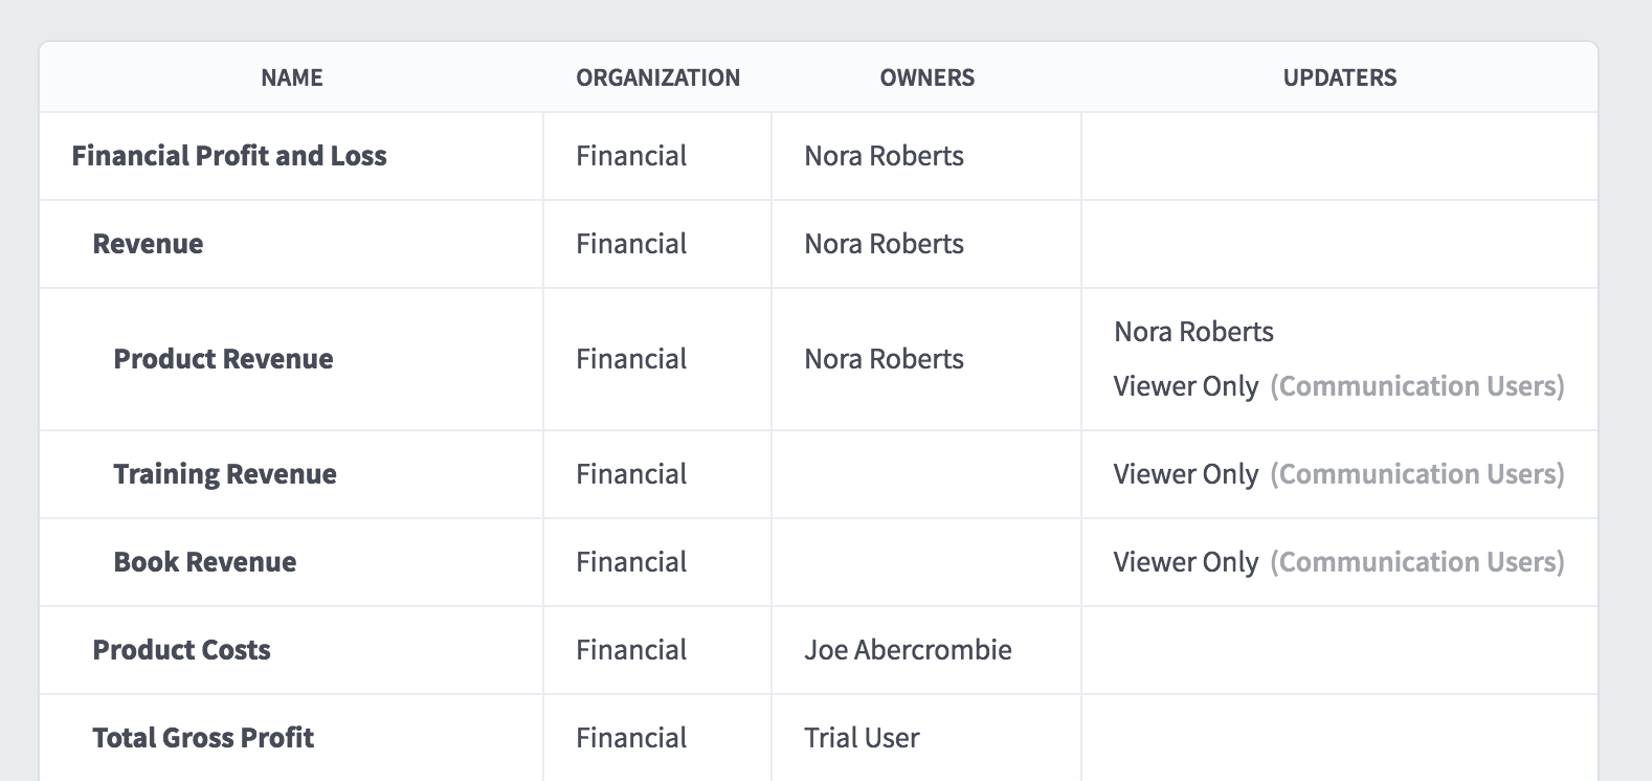
When you’re done you see a report like this.
Red KPIs Report
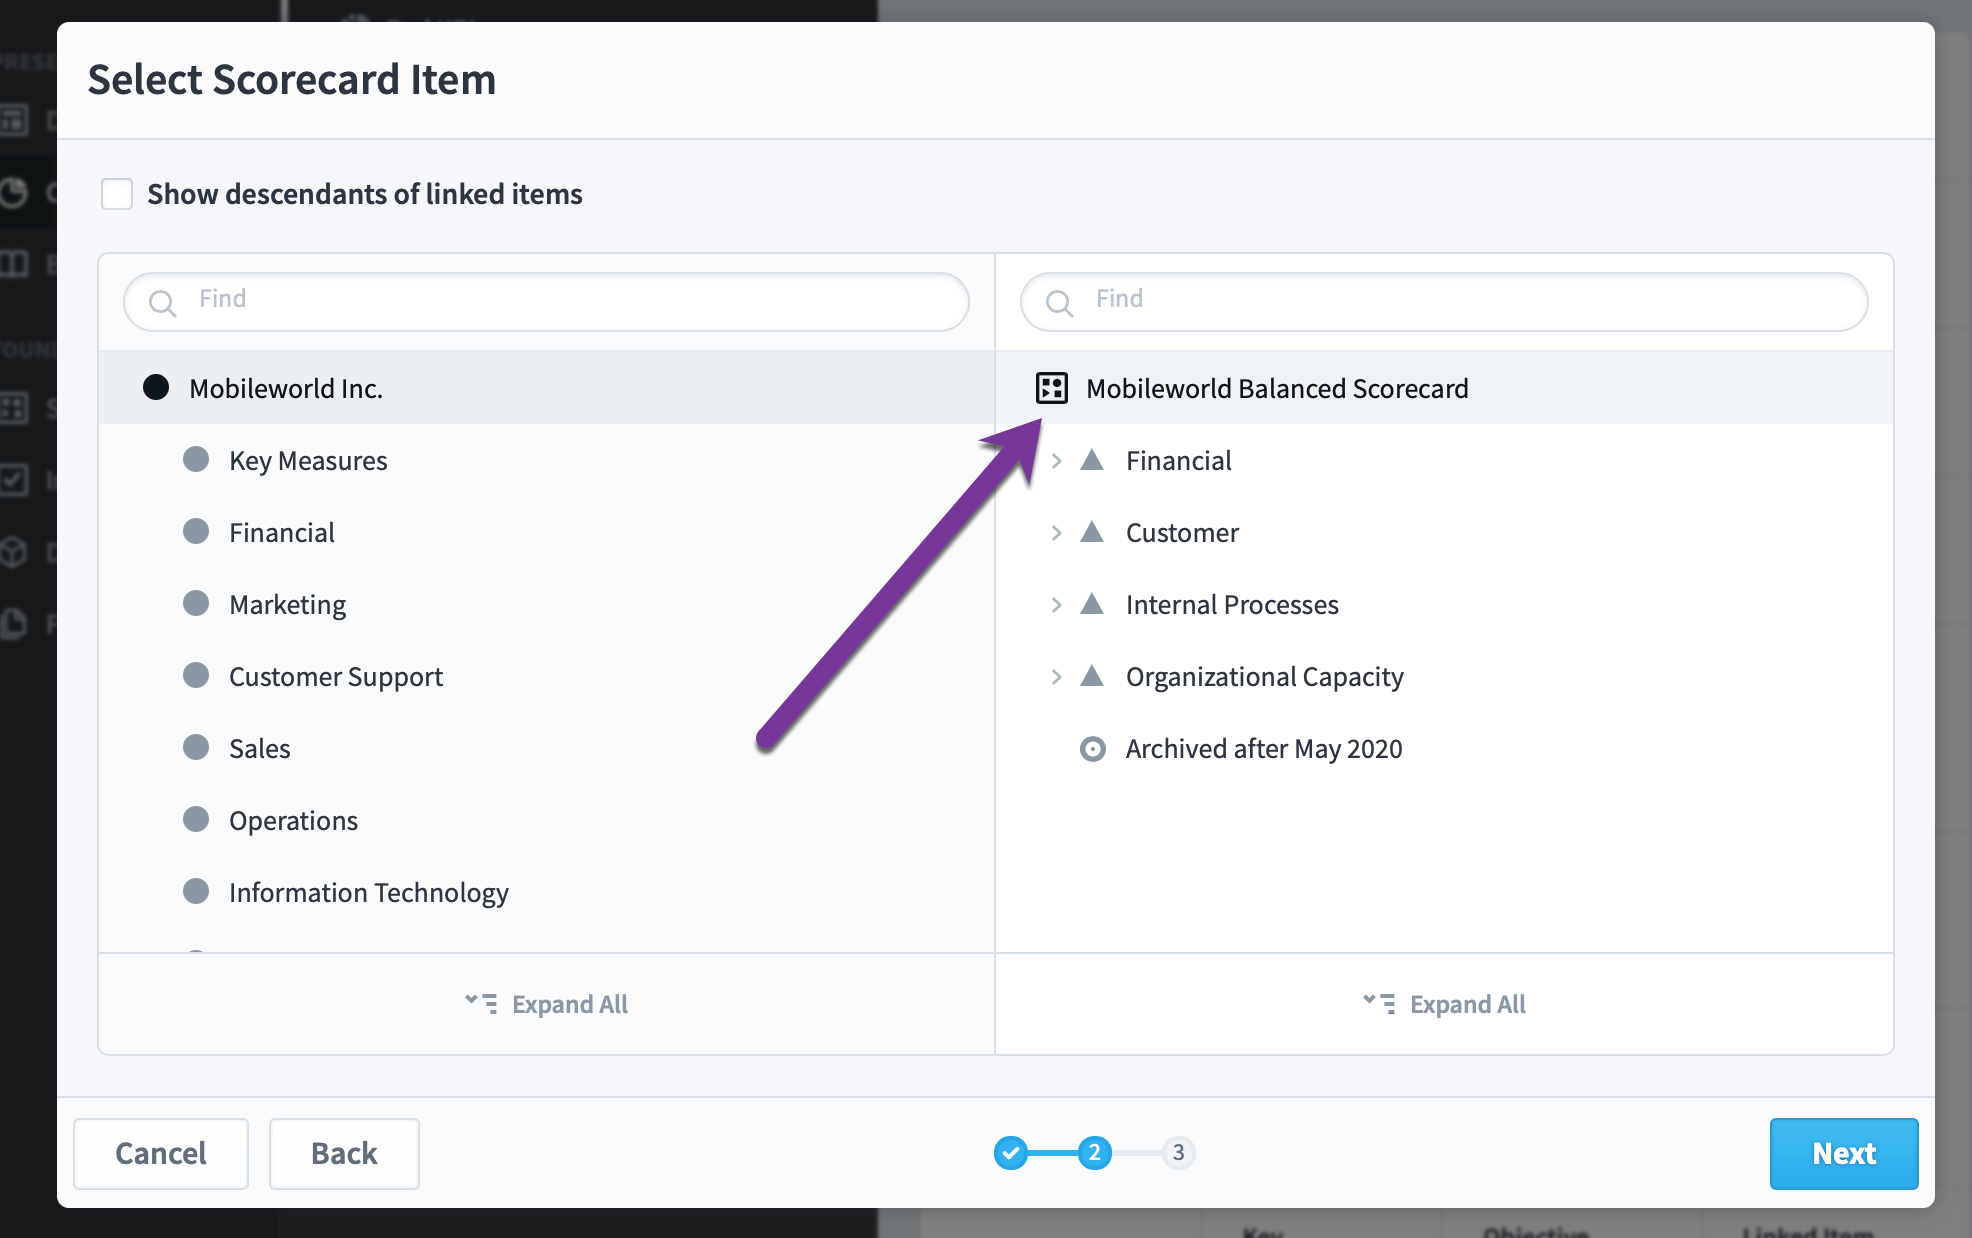
The Red KPIs report is probably the most popular report in Spider Impact and shows you all of your underperforming KPIs. The first step is to choose a scorecard item. Here we're going to show all red KPIs for the entire Mobileworld scorecard.
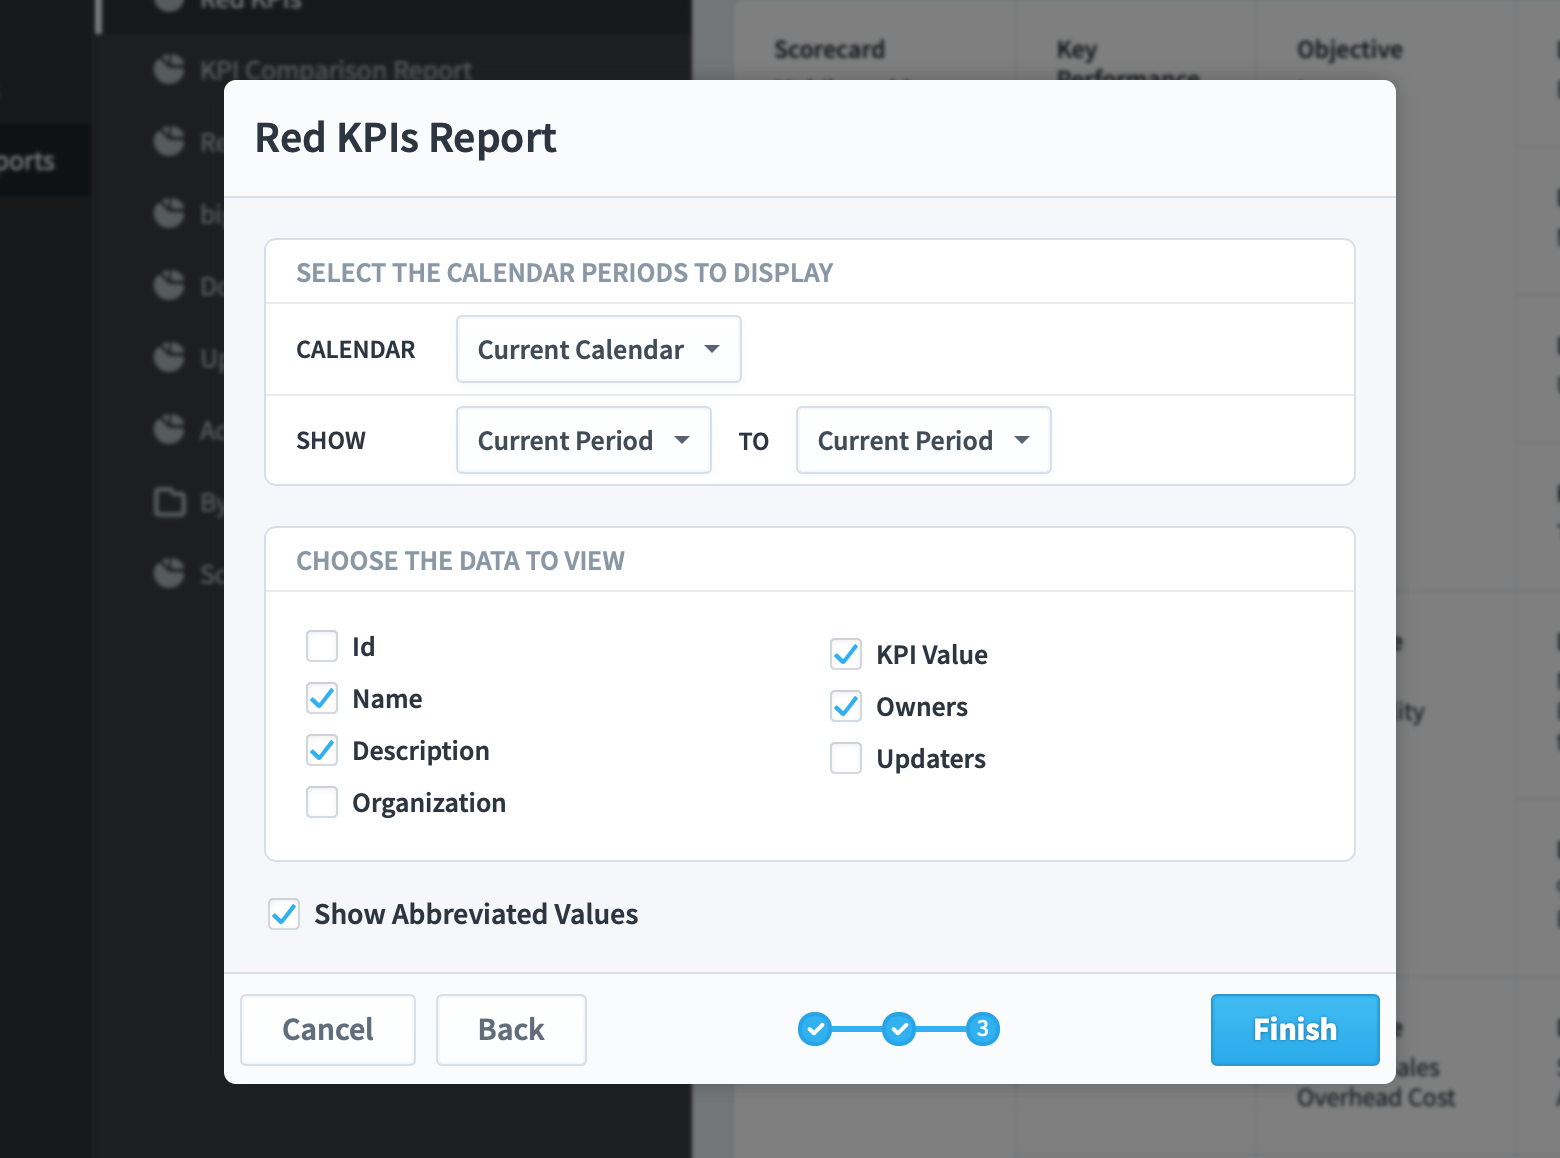
You then choose your display options. Most of the time the defaults will work just fine.
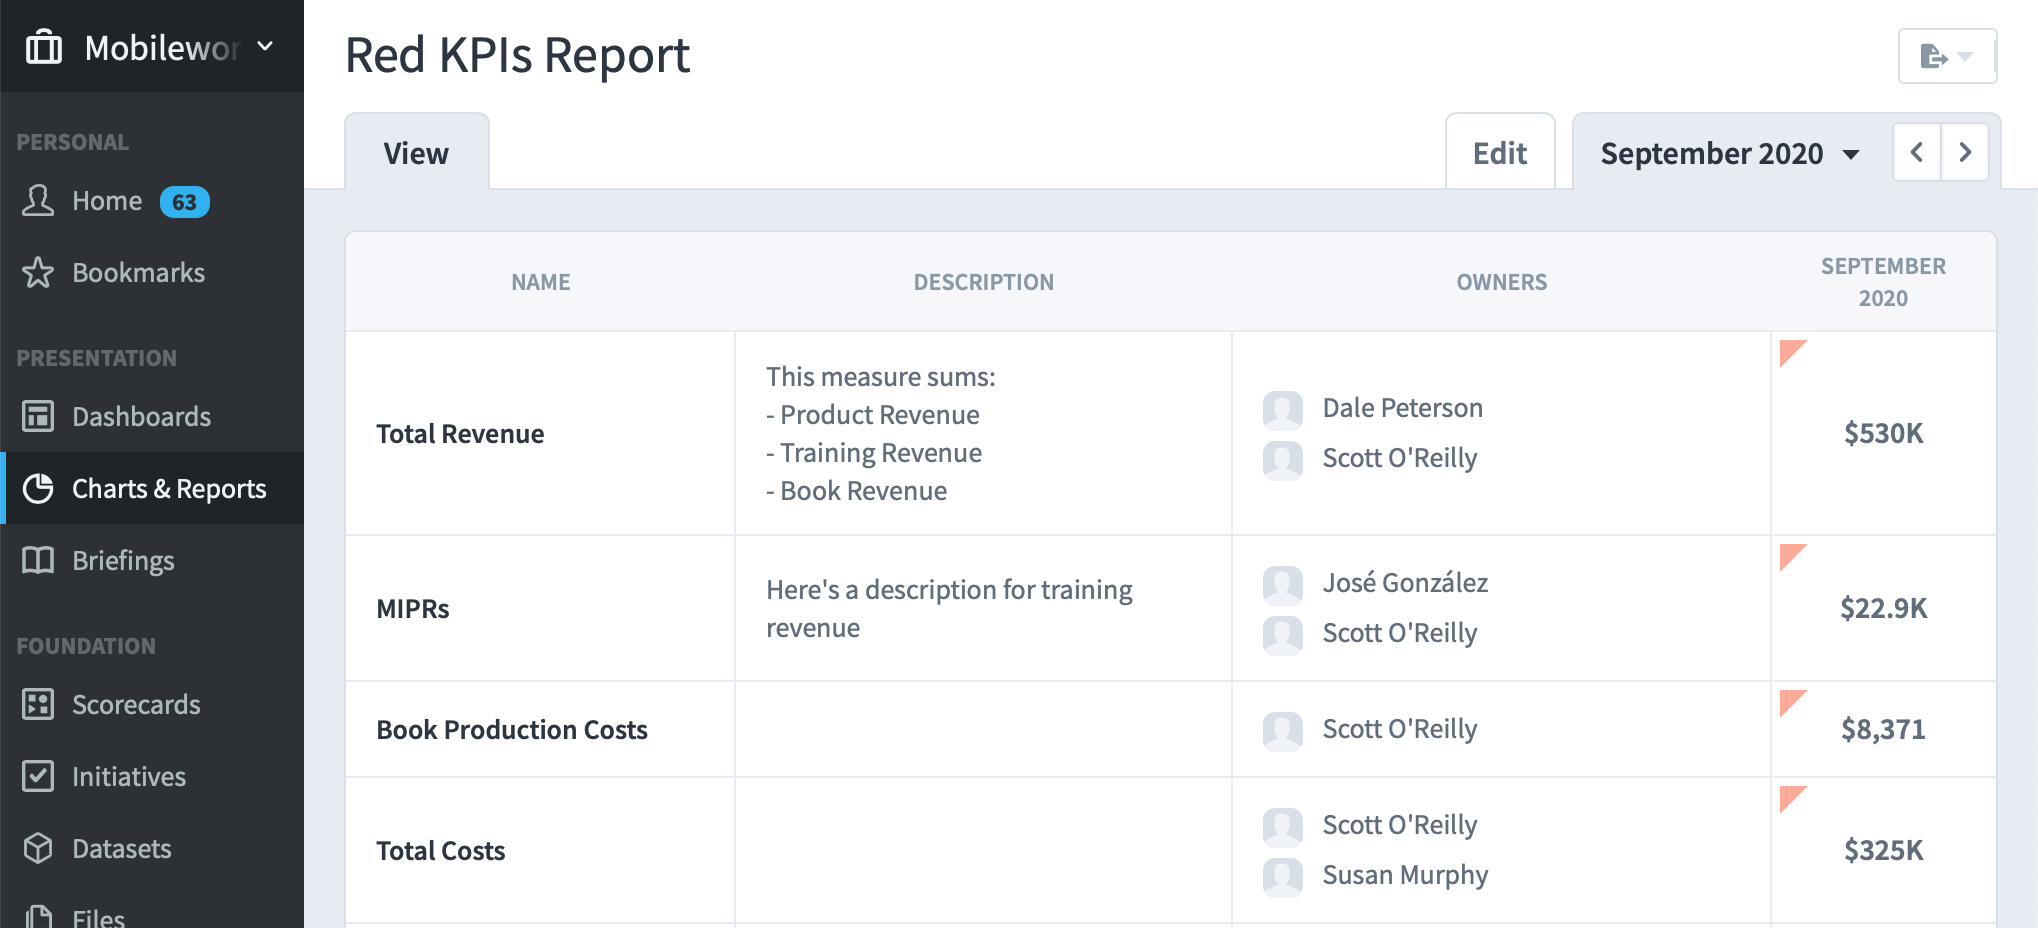
When you click Finish you'll see a report that looks like this:
Missing KPI Values Report
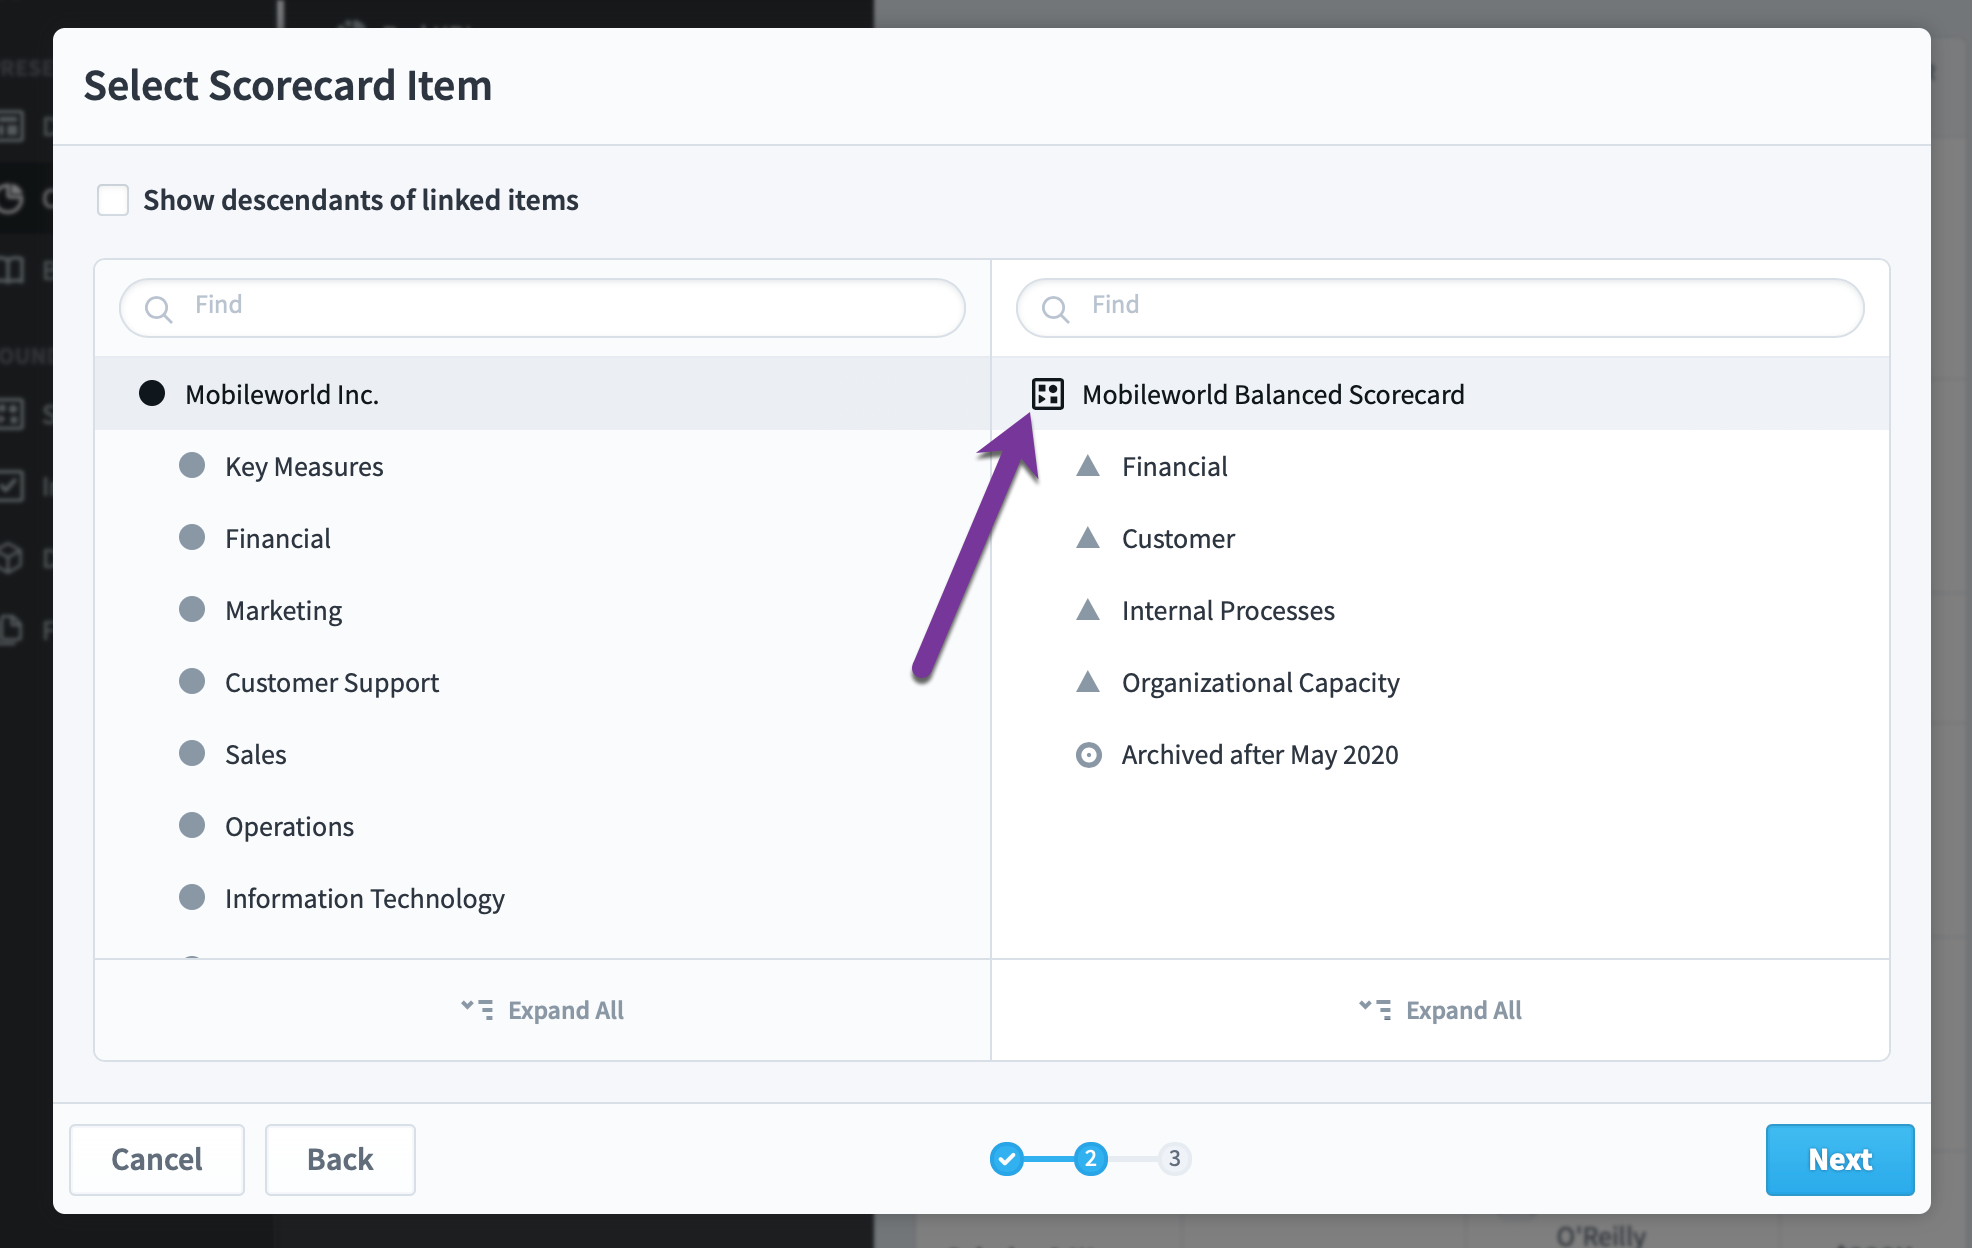
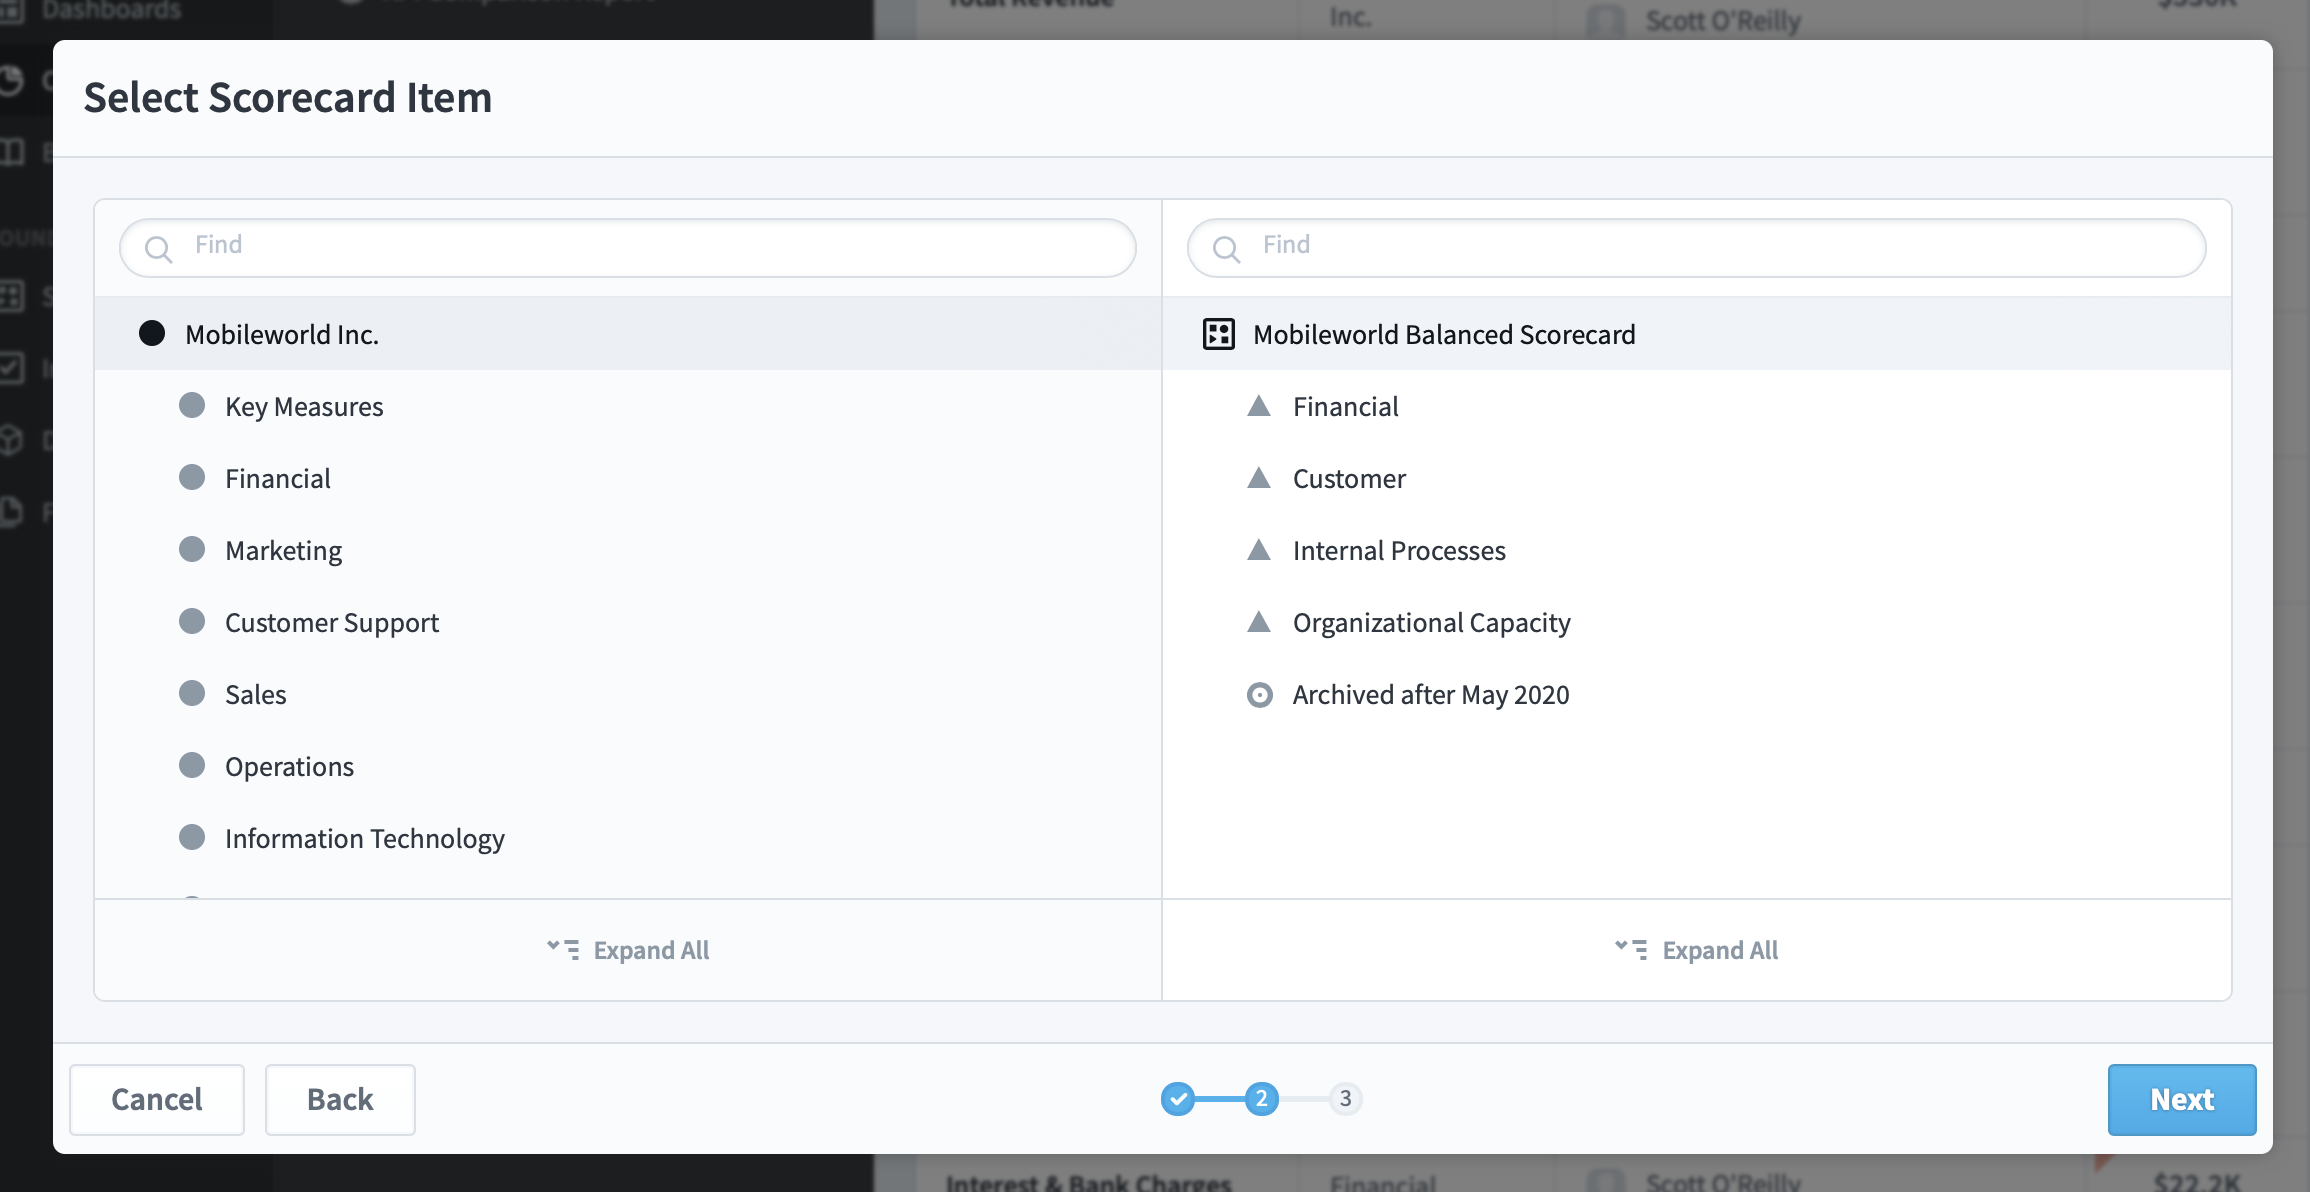
The Missing KPI Values Report shows you all KPIs that haven't been updated for a particular time period. To start, you need to choose a scorecard item. Here we're going to run the report for the entire Mobileworld Scorecard.
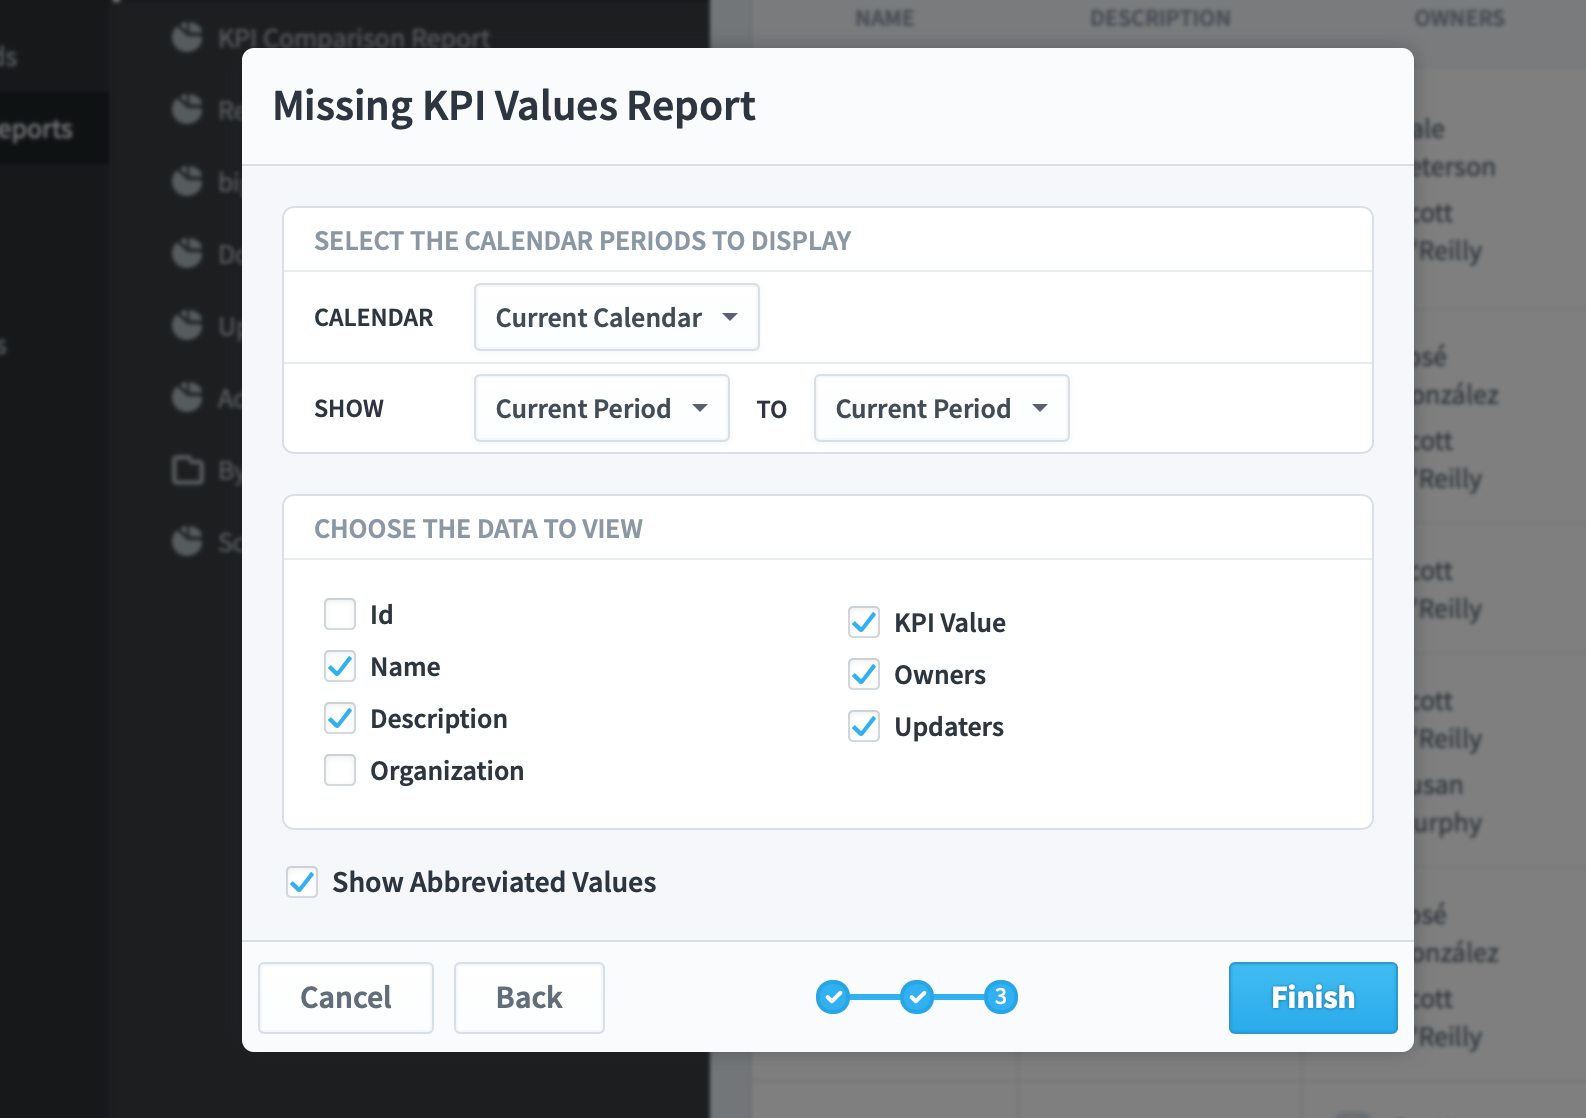
Next you choose your display options. The defaults work great most of the time.
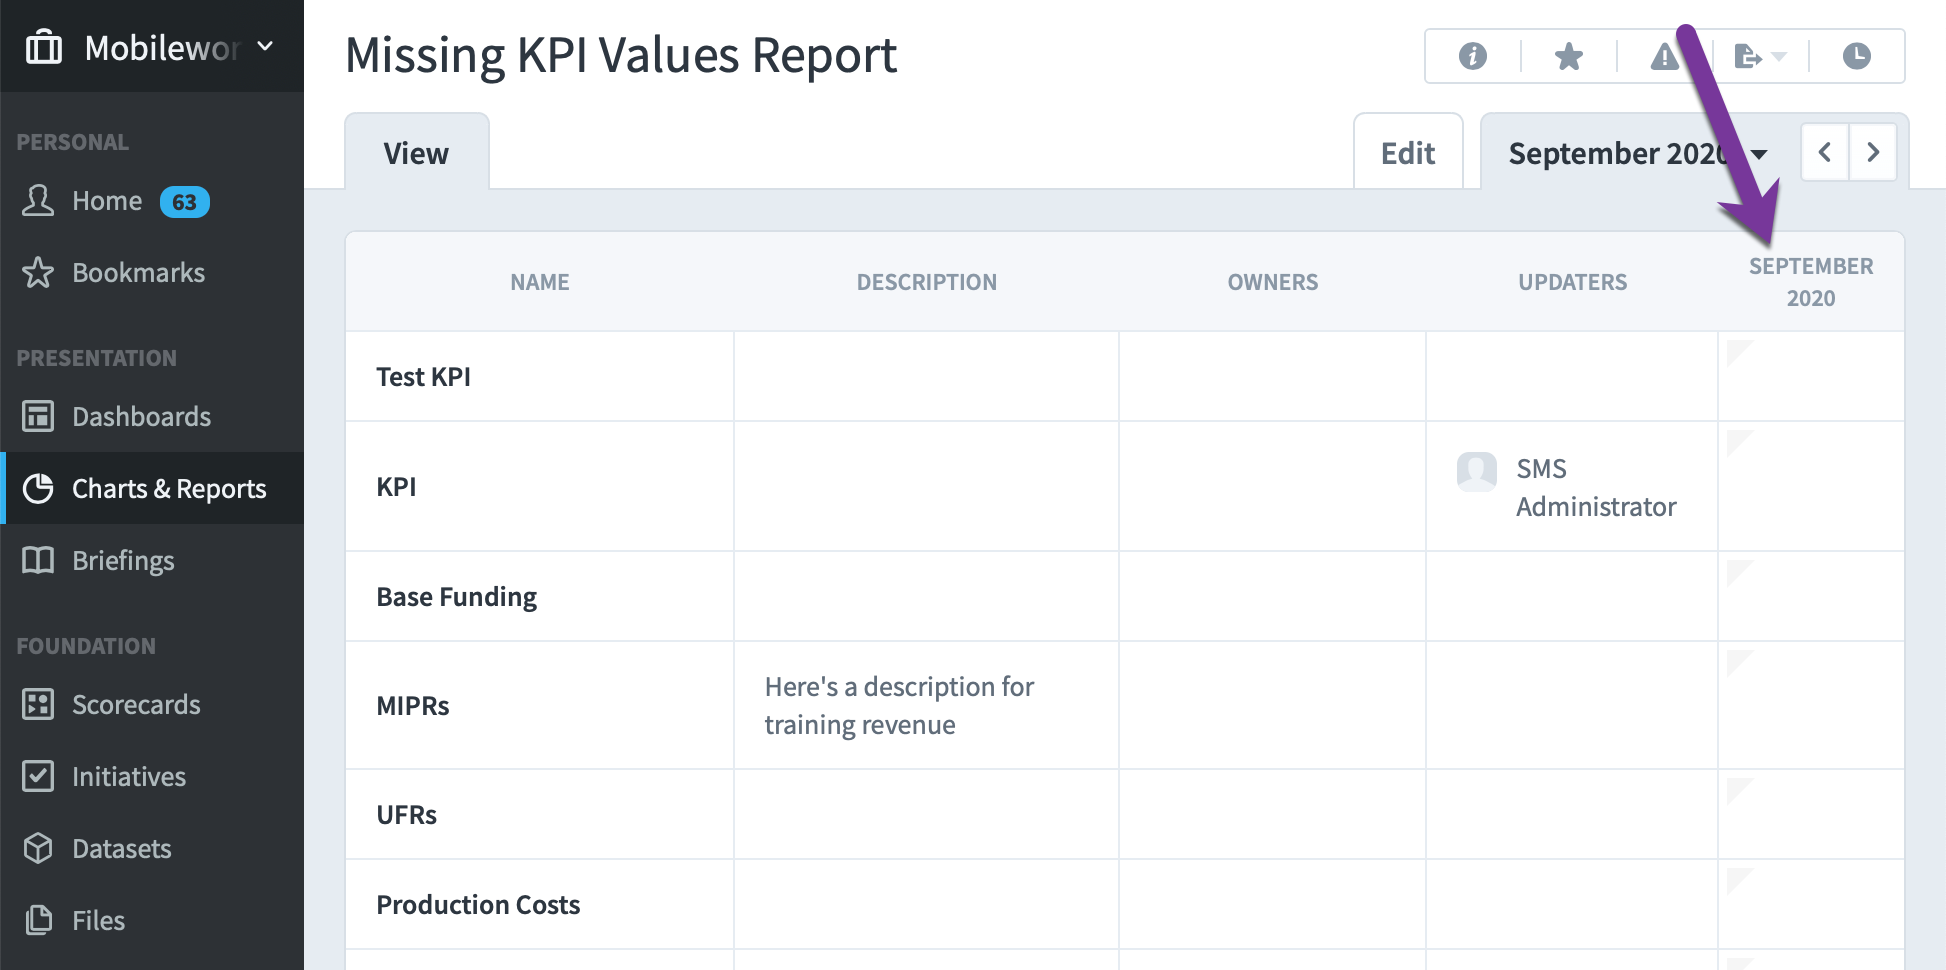
When you're done you'll see a report like this:
Annual KPI Data Report
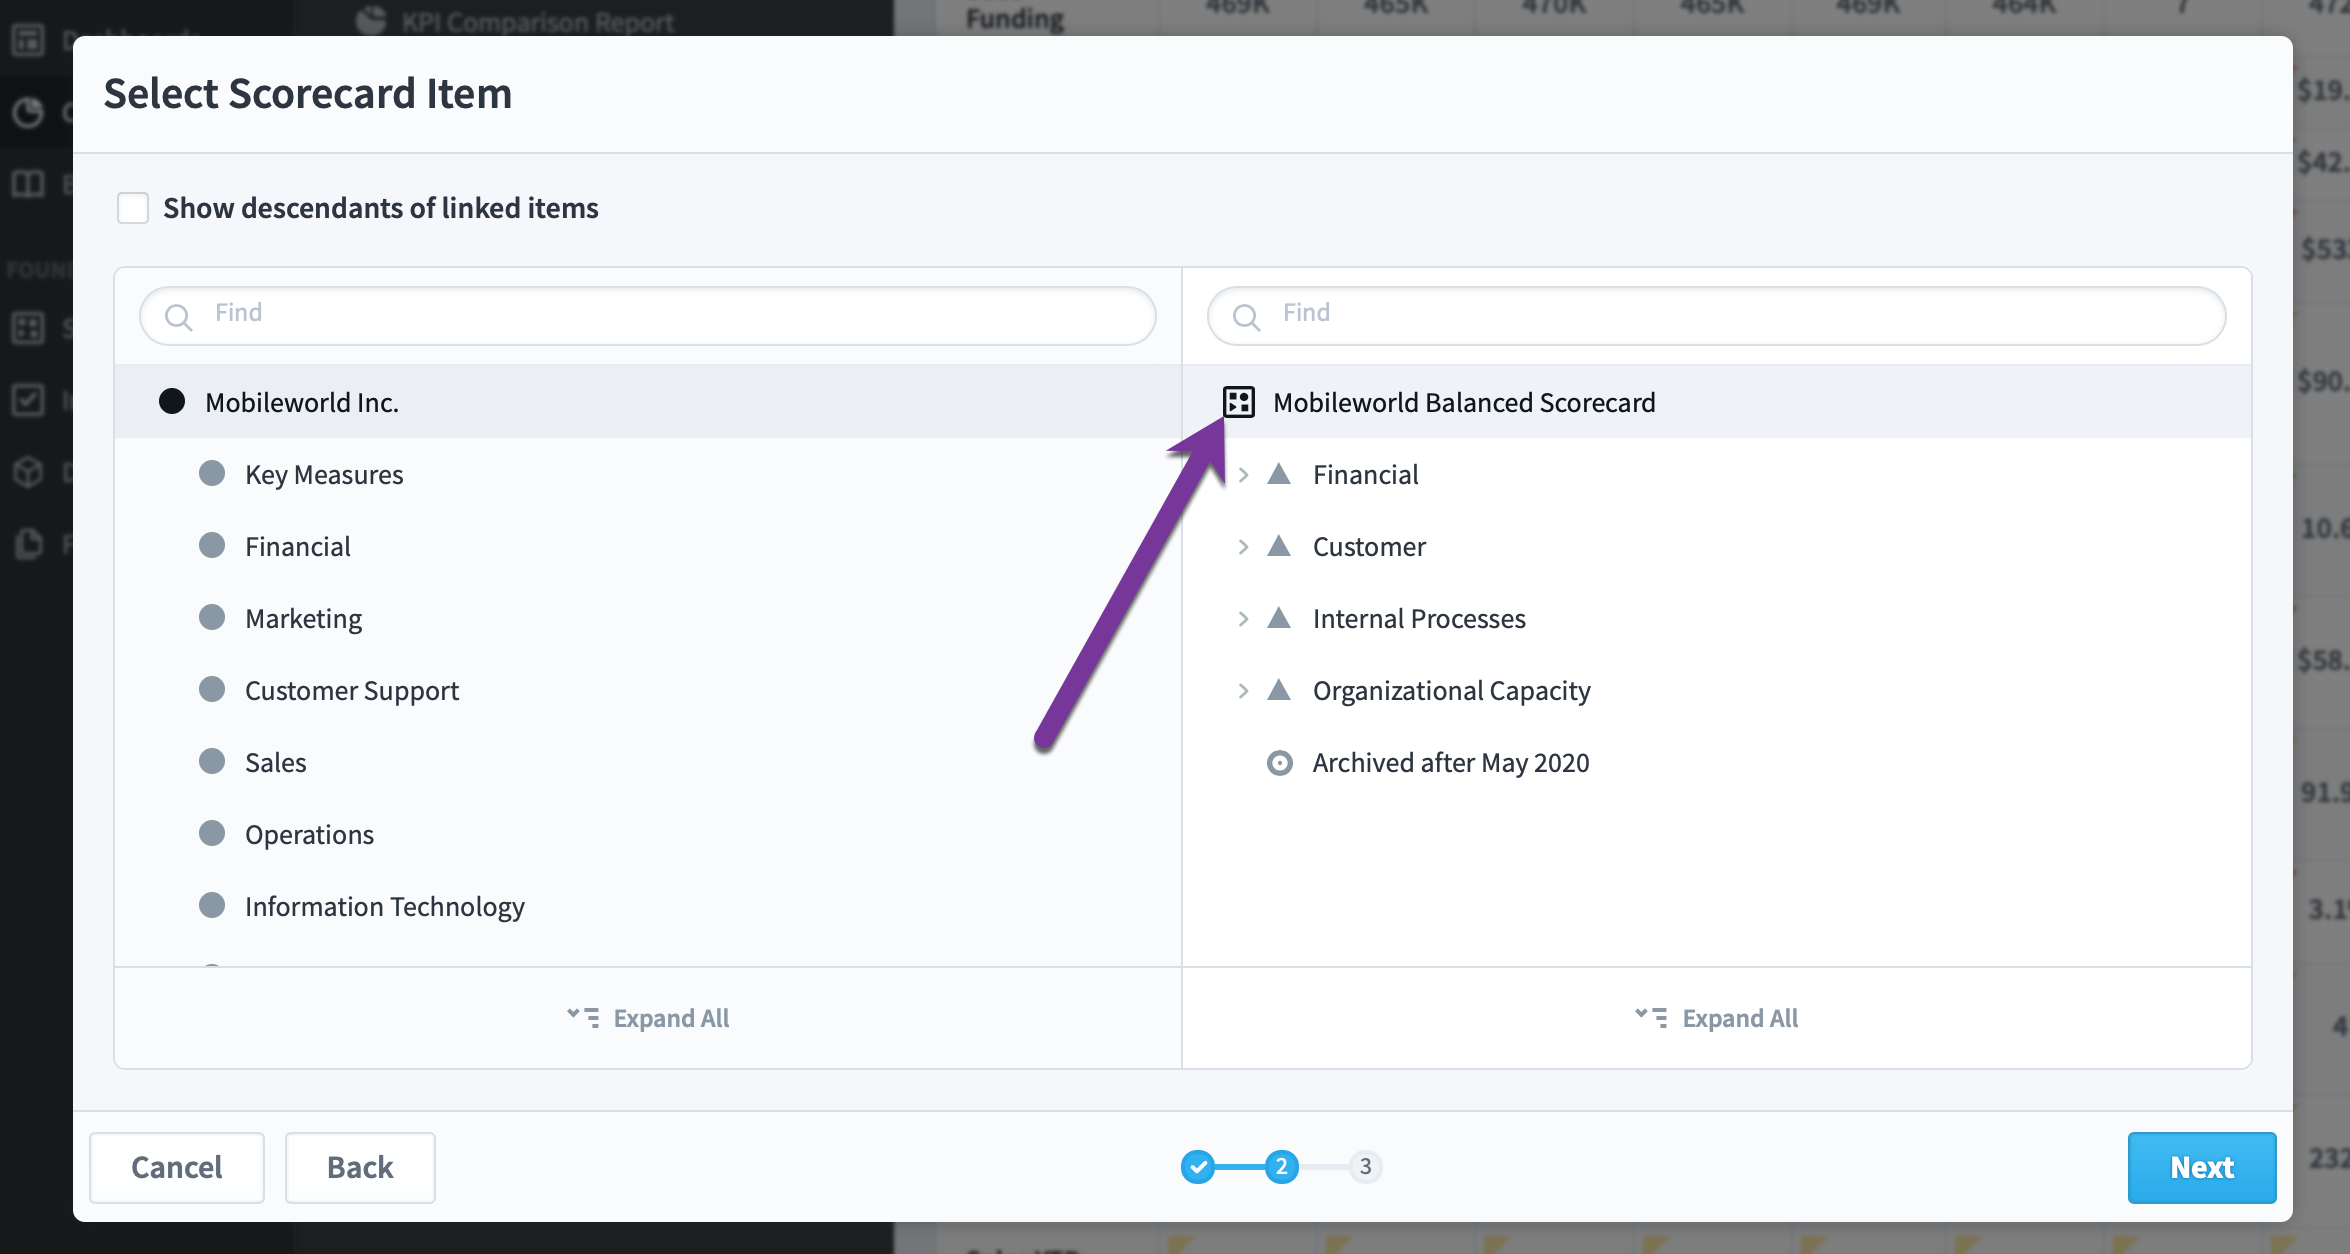
This is similar to the data shown on the Scorecards KPIs tab. The first step in building the report is choosing which scorecard item you want to show the KPIs for.
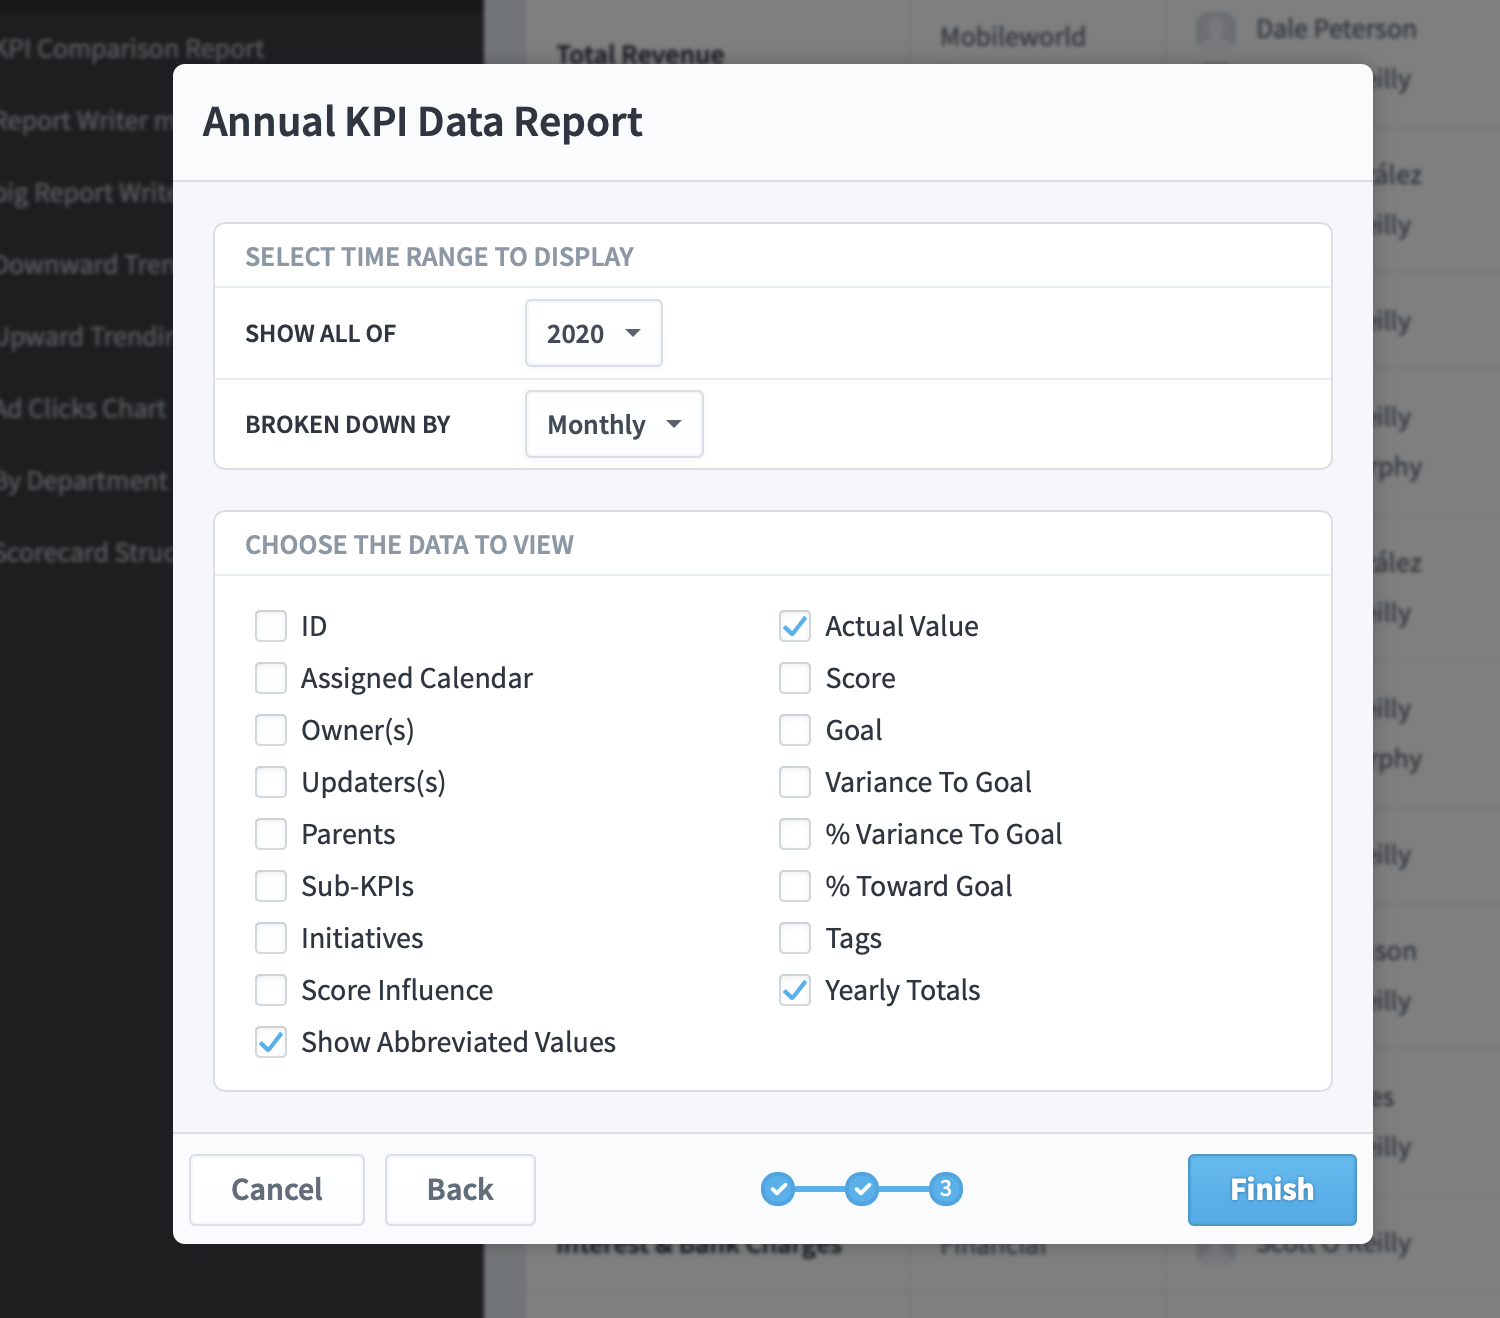
The next step is choosing what data should be shown on the report. The defaults only show the actual values and yearly totals.
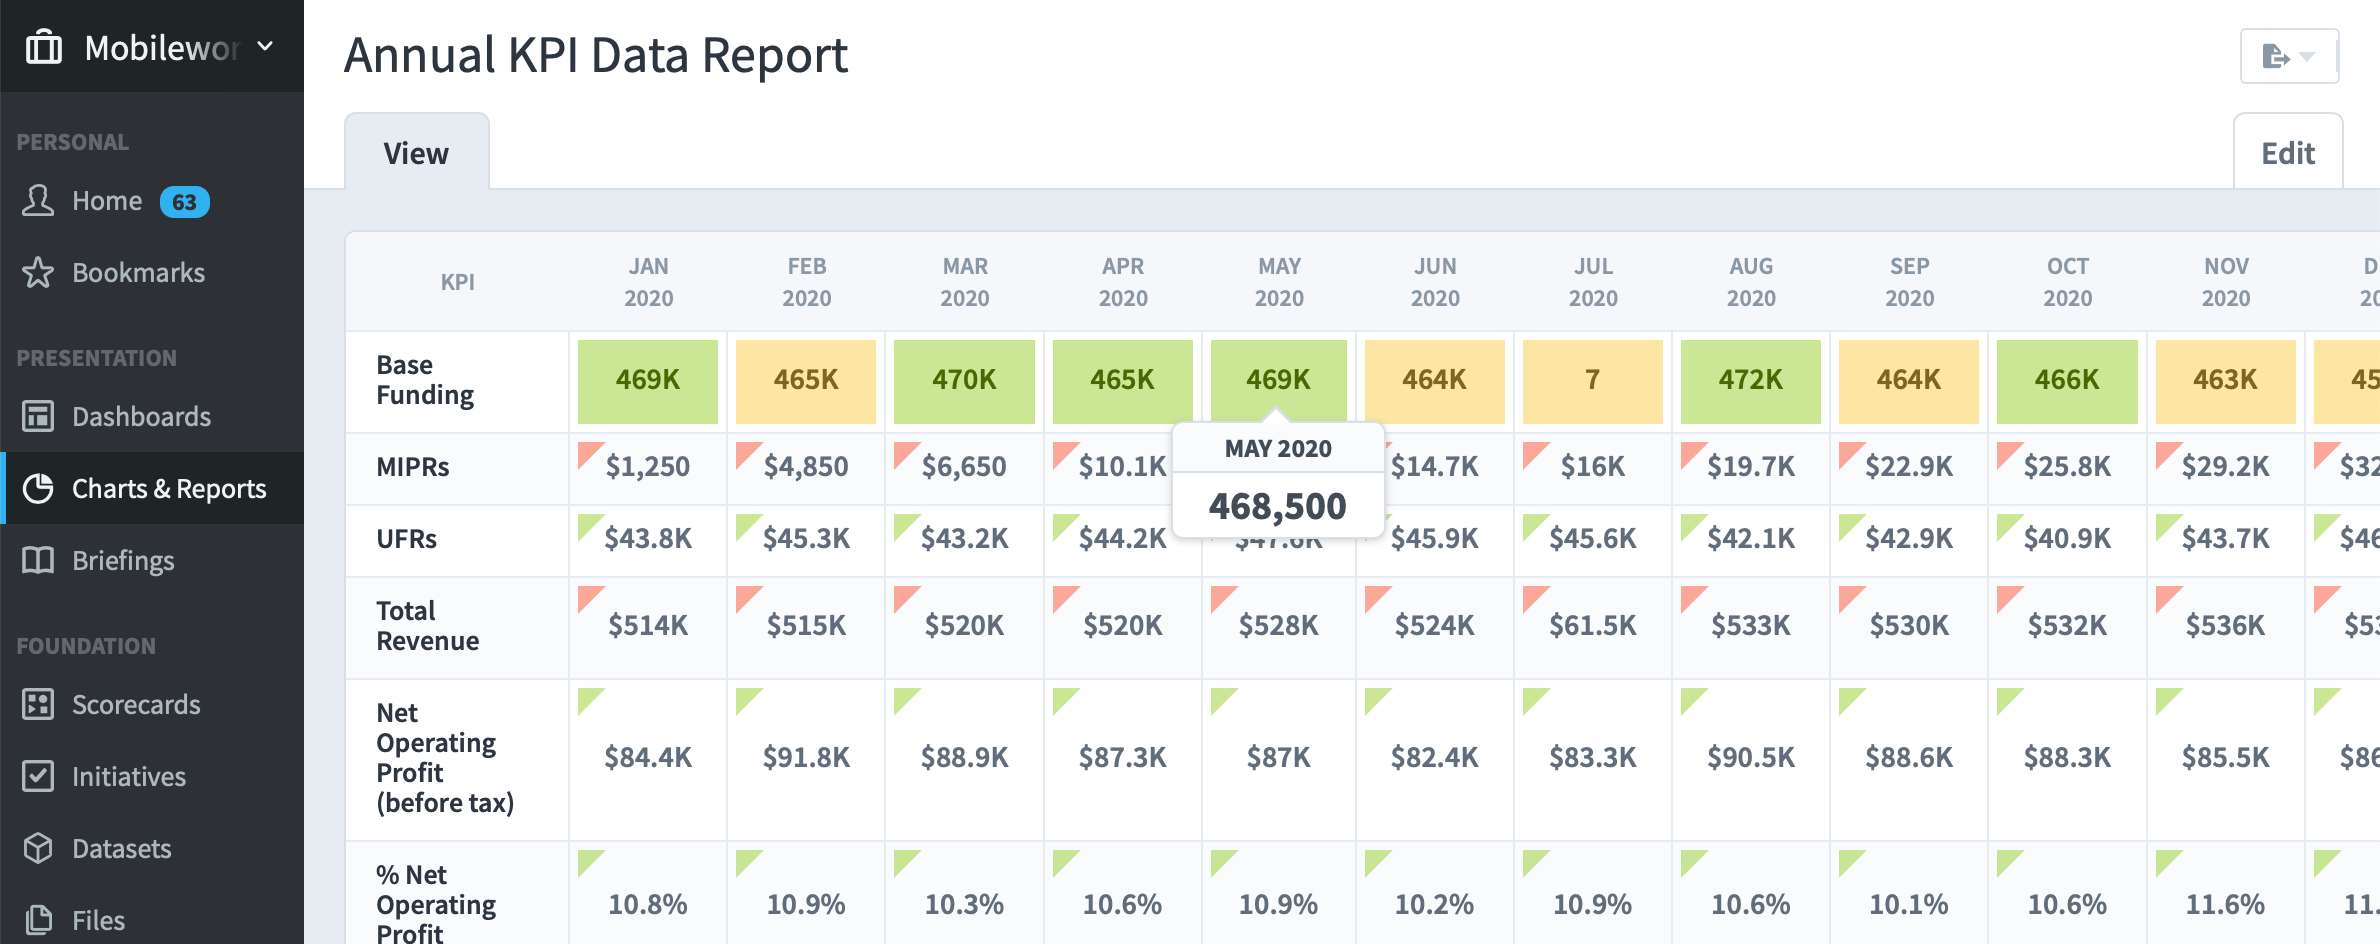
When you're done you'll see a report that looks like this:
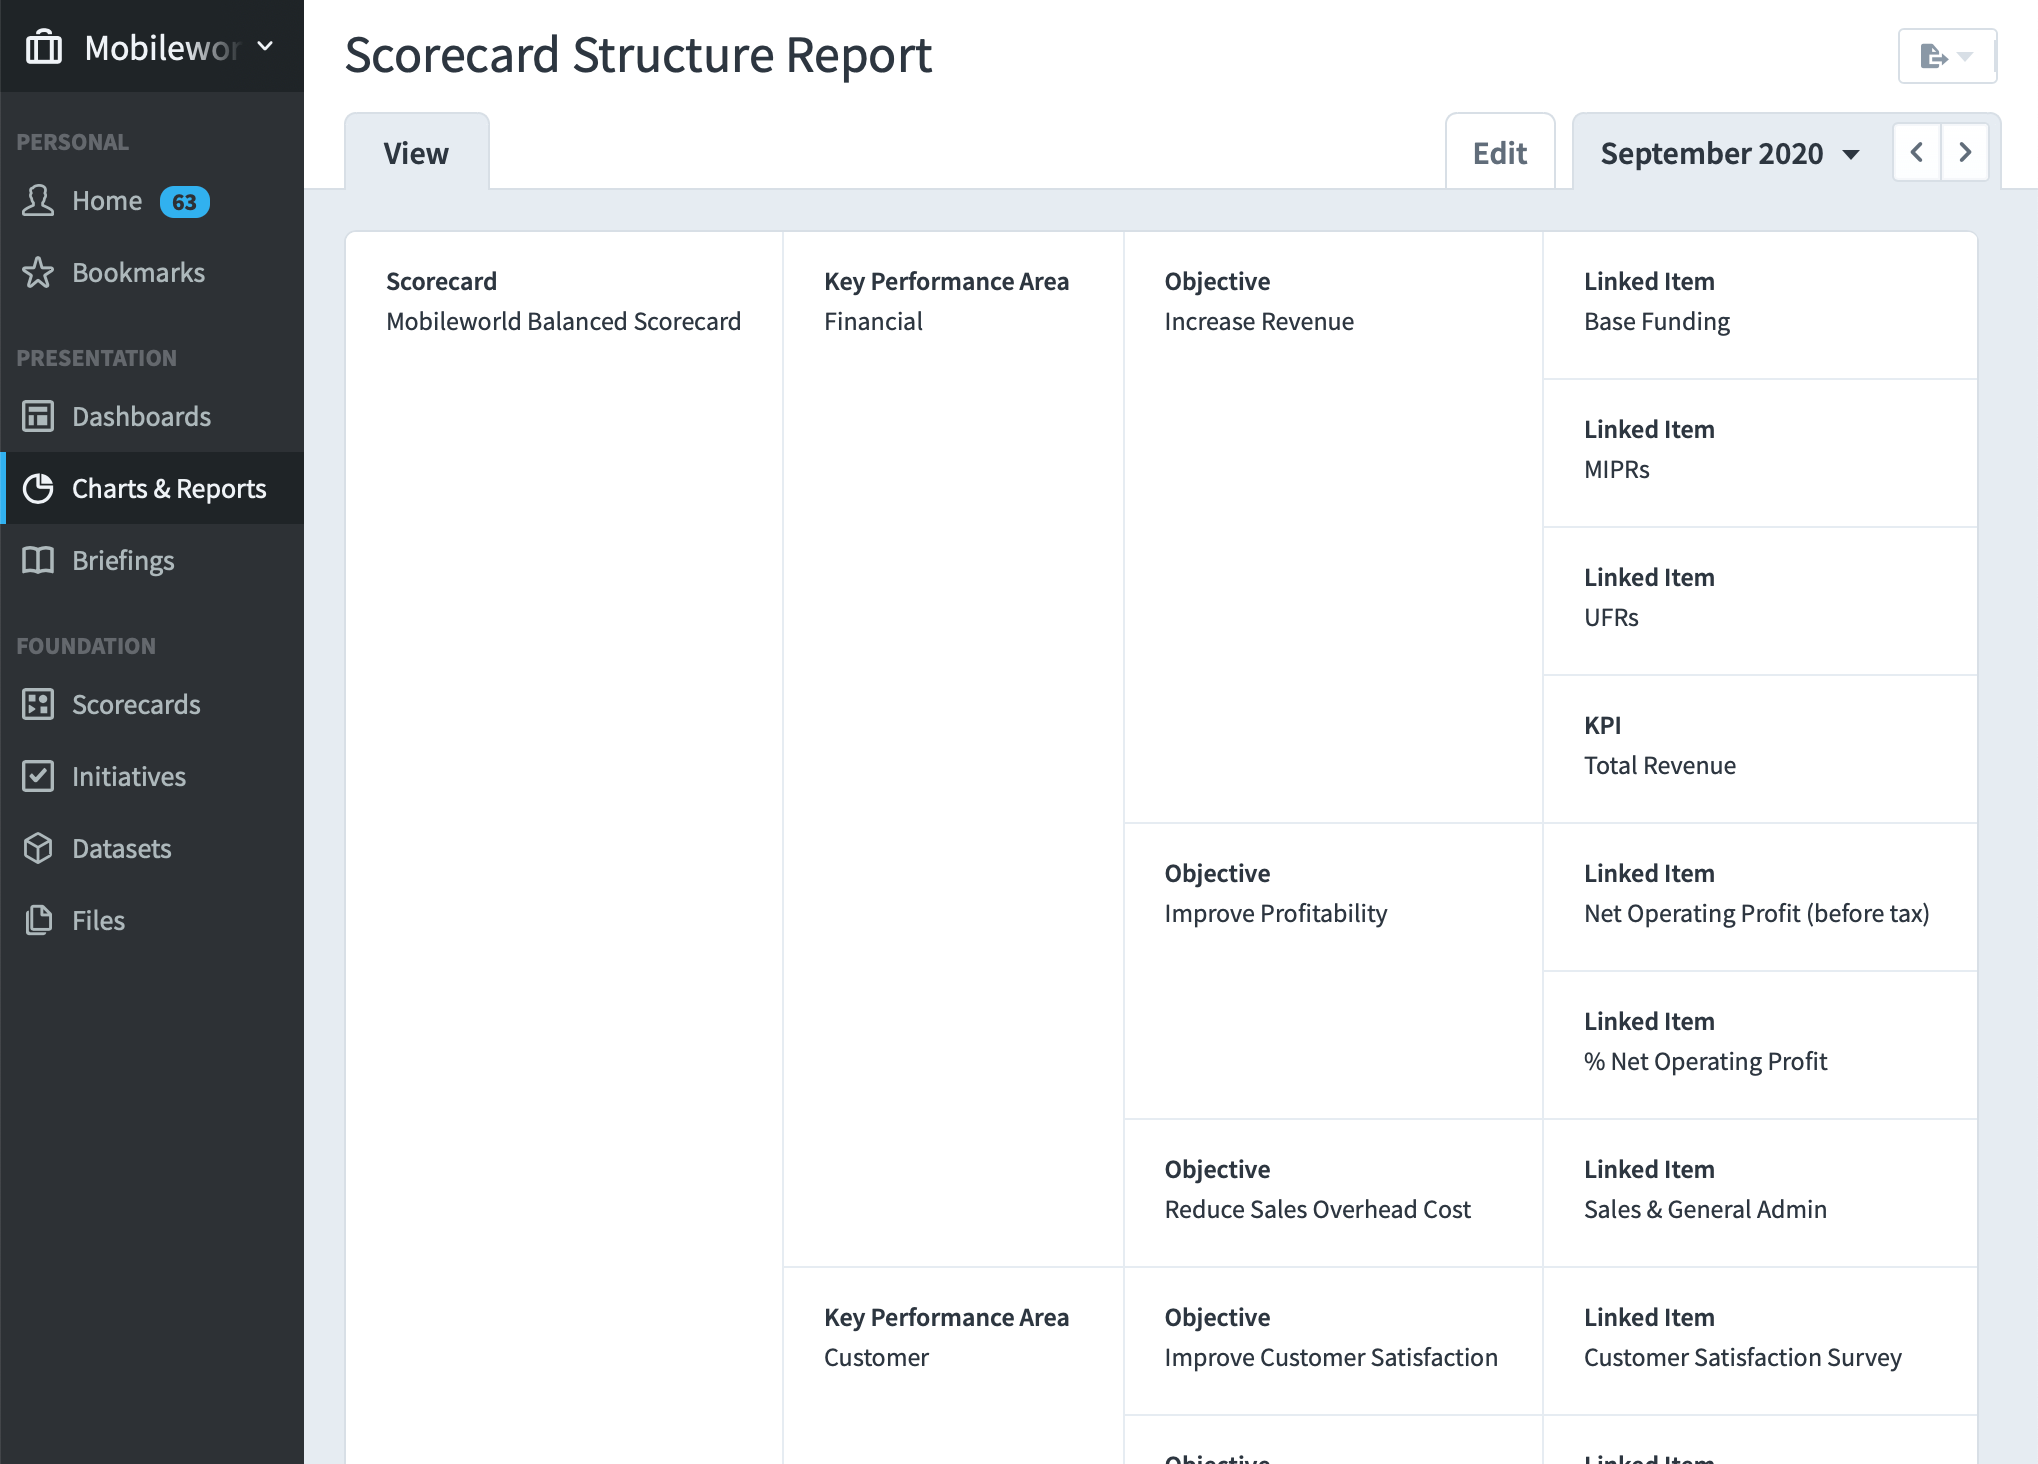
Scorecard Structure Report
The Scorecard Structure Report doesn't show any kind of performance data. It's all about the structure of your scorecard. To build the report, first choose a scorecard item. In this example we're going to choose an entire scorecard.
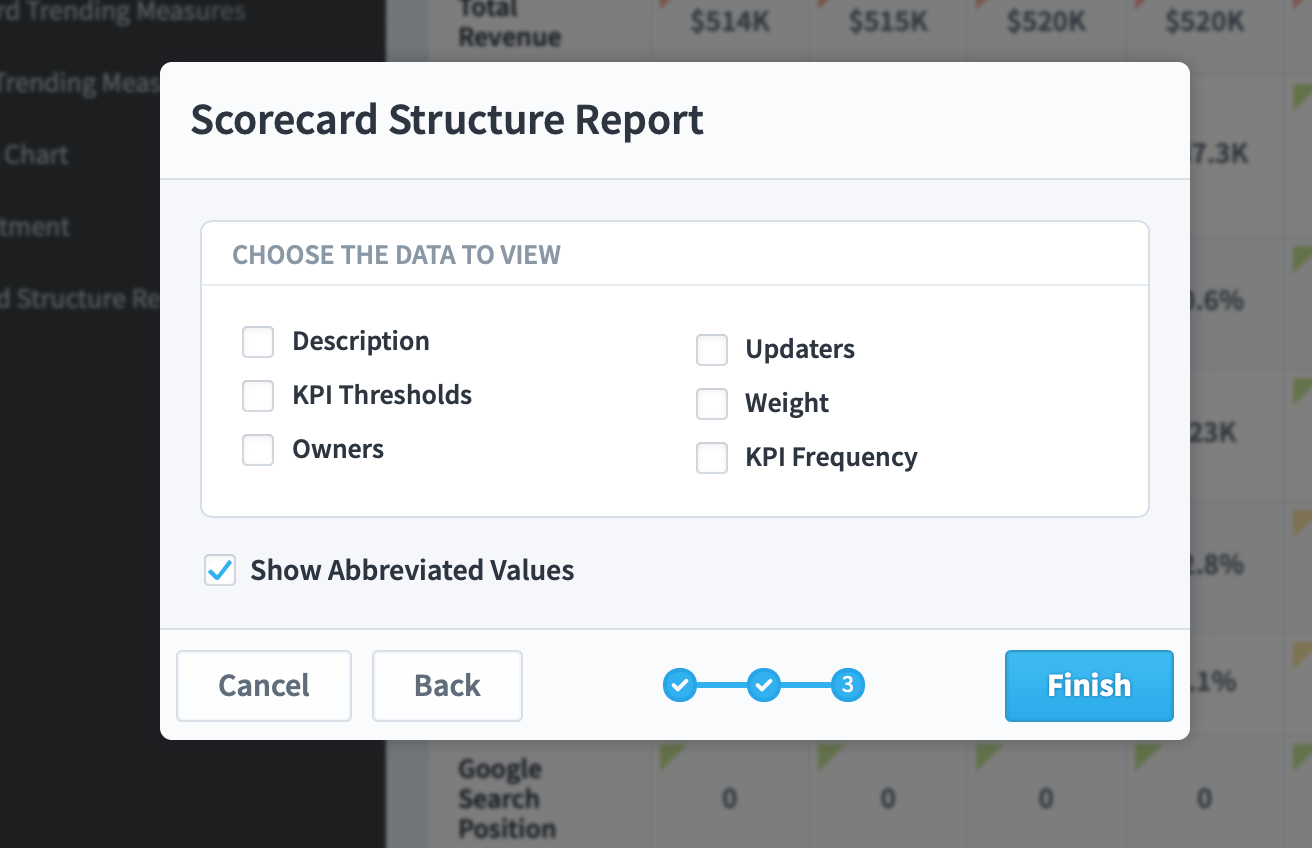
Then you choose what information you want to show. By default it doesn't include any of these extras.
When you click Finish you'll see a report that looks like this.
KPIs by Calendar Report
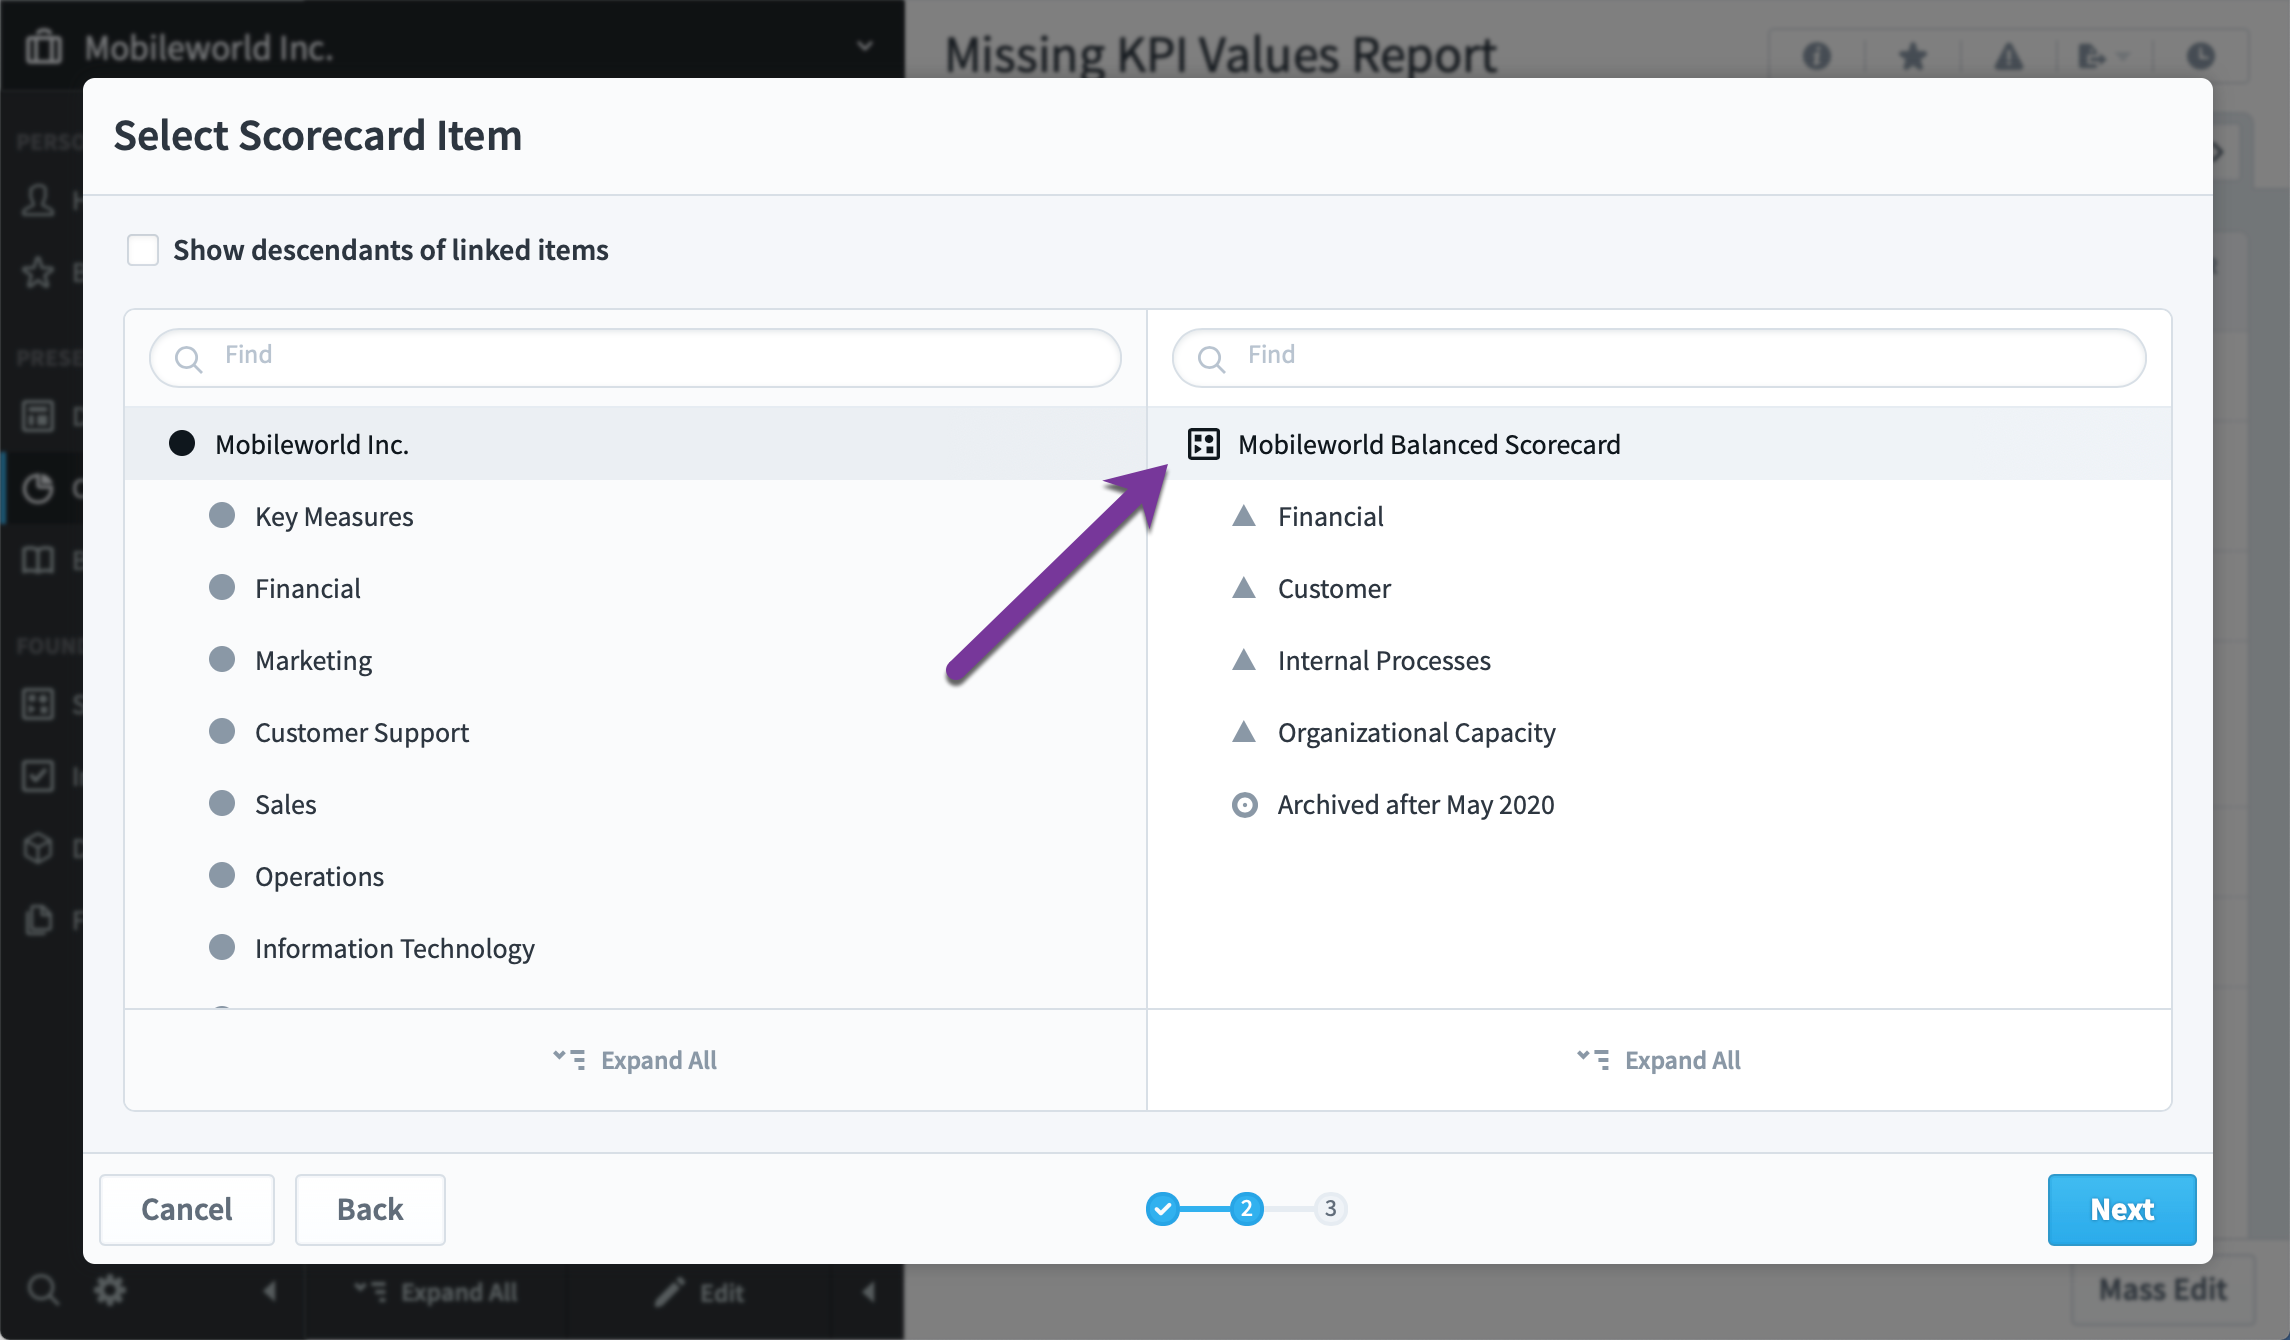
The KPIs by calendar report shows you all of your KPIs that match a particular update frequency. First we'll choose the entire Mobileworld Scorecard.
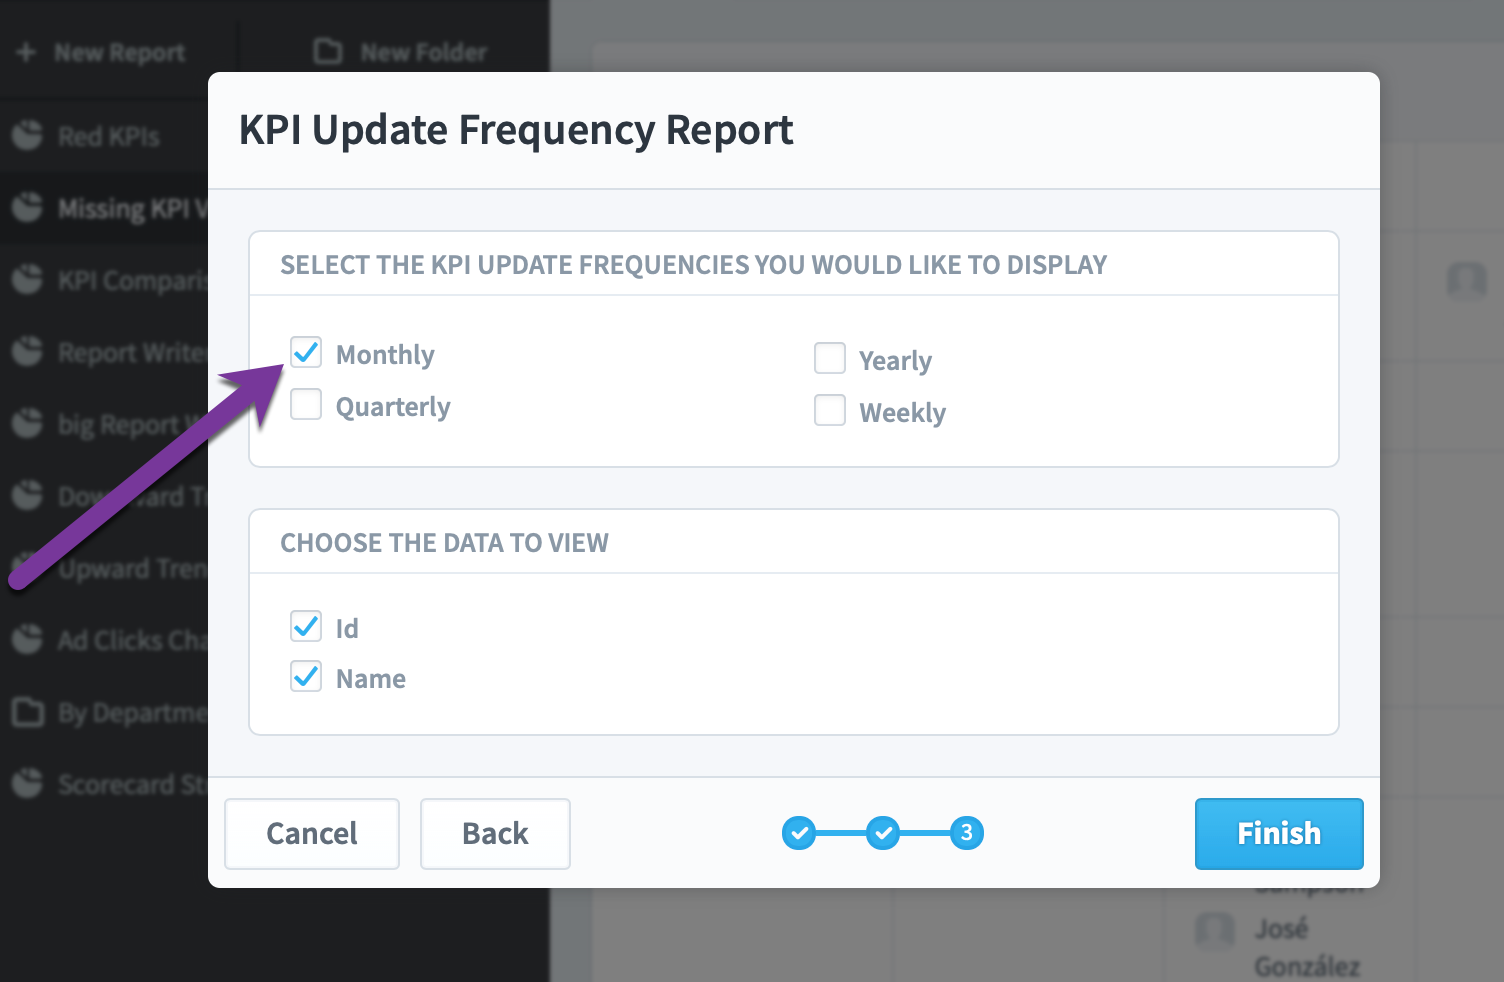
Then we'll choose which calendars we want. In this example we'll choose Monthly.
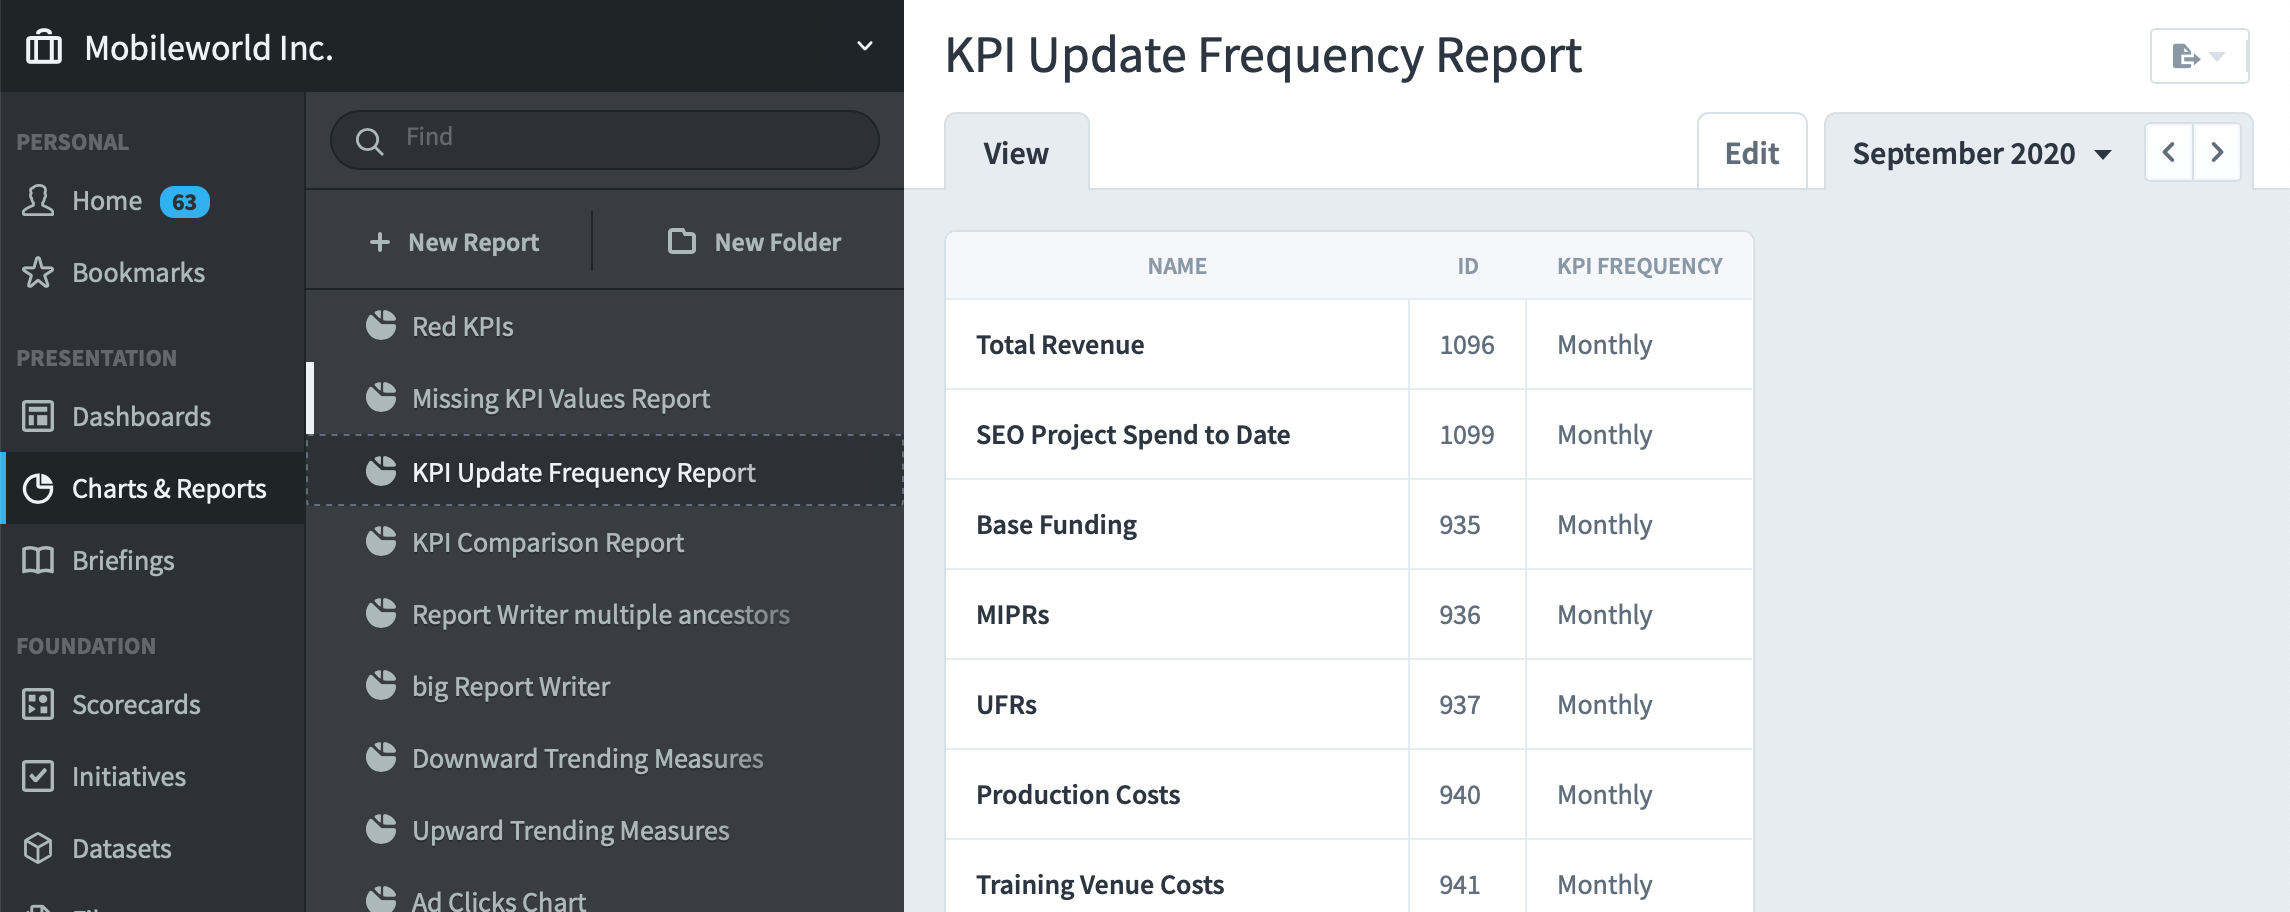
When we click Finish it shows a list of all monthly KPIs in that scorecard.
KPI Comparison Report
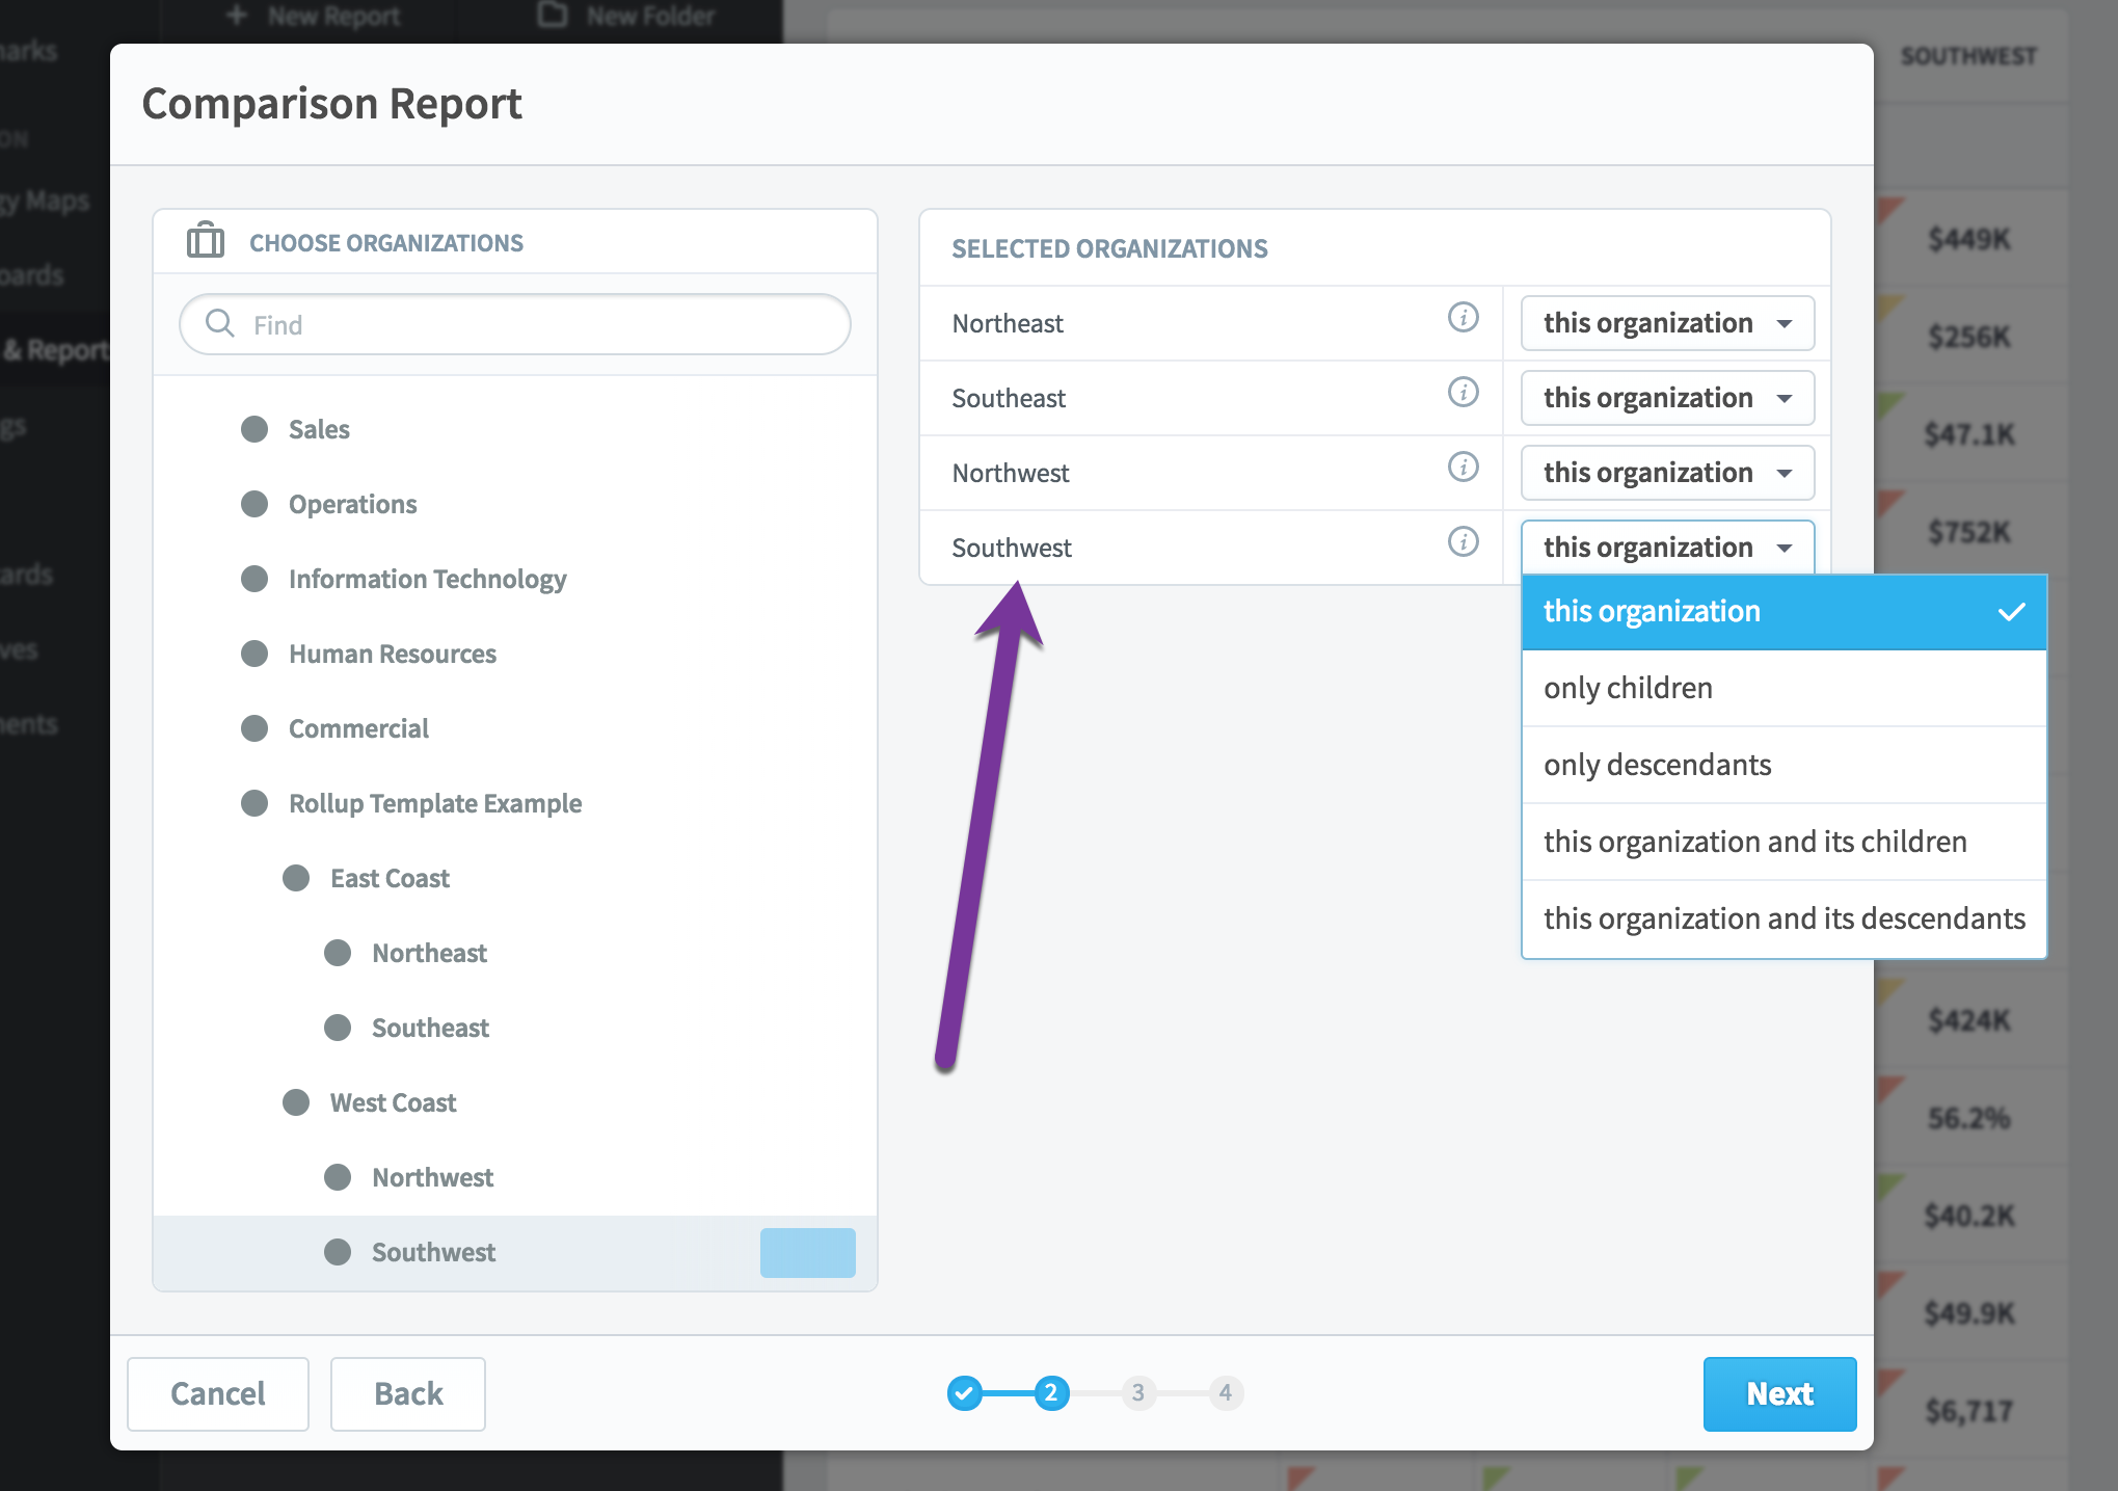
The KPI comparison report is used to compare organizations that have similar KPIs. The first step in the wizard is to choose which organizations you want to see in your report. You can either select each organization one at a time, or you can automatically include an organization’s descendants.
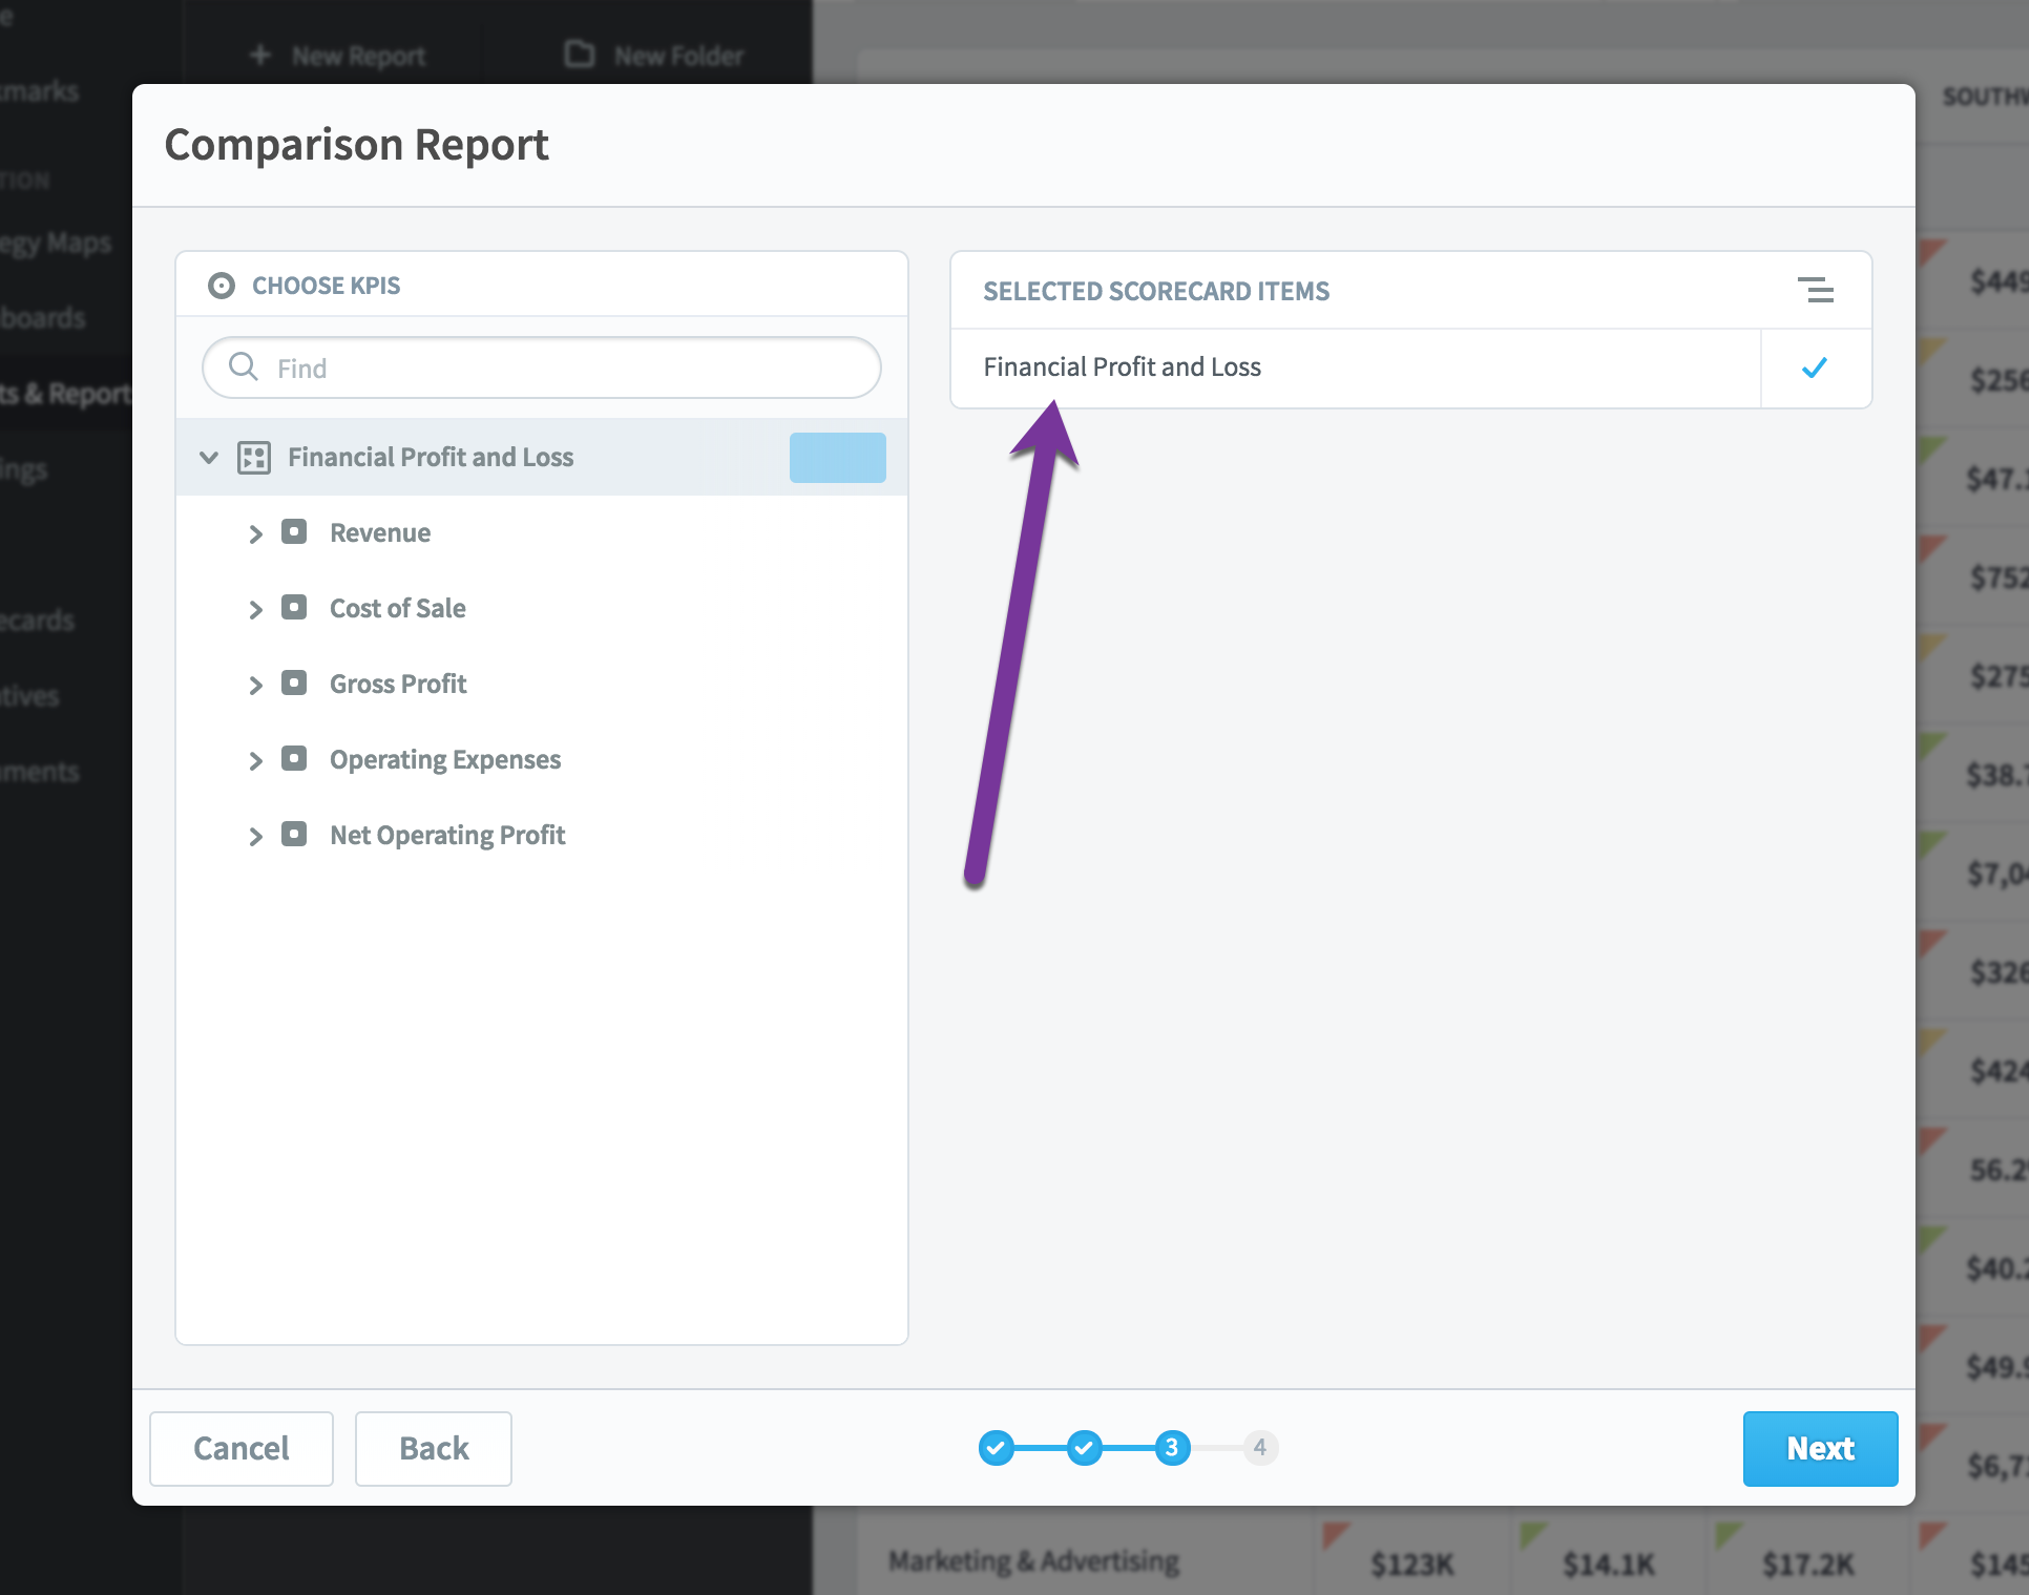
Once you’ve selected your organizations, the next step is to choose your KPIs. Here I’ve selected the scorecard root, which will automatically include all of the KPIs.
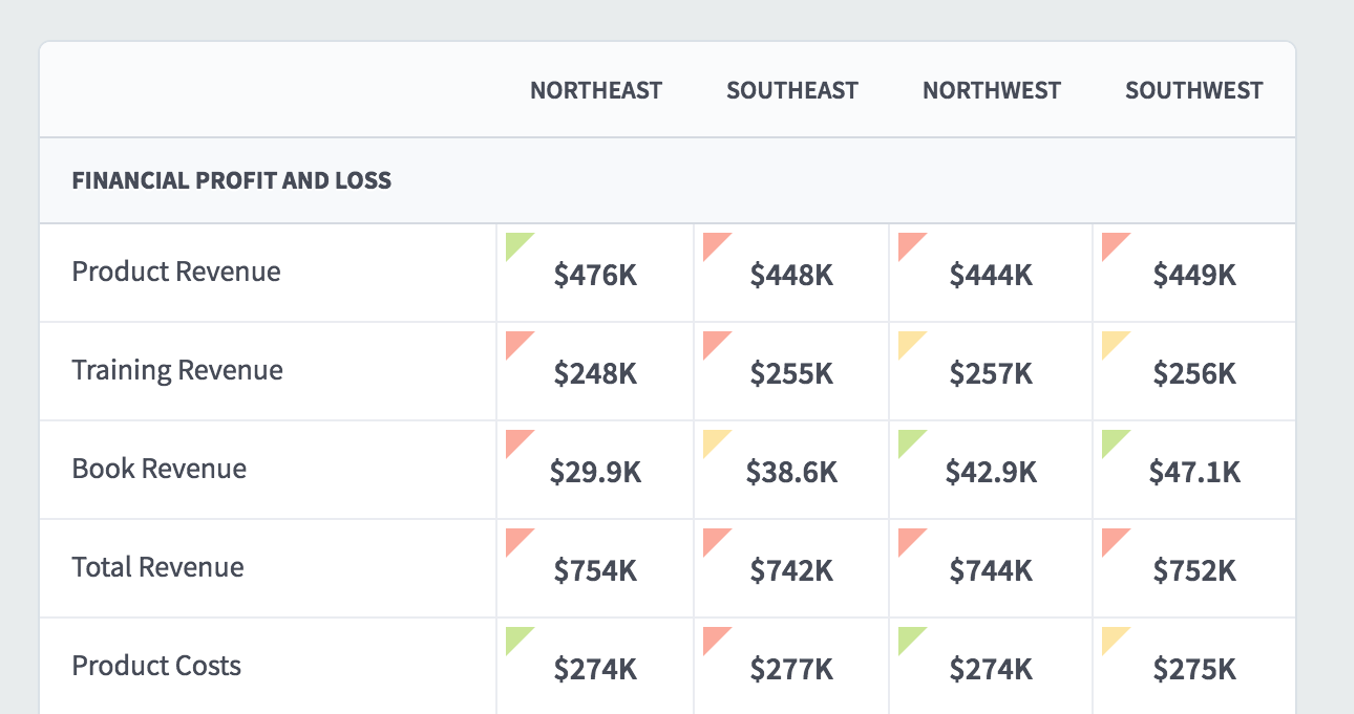
When we’re done we see a report with all of the KPIs for each of the four selected organizations.
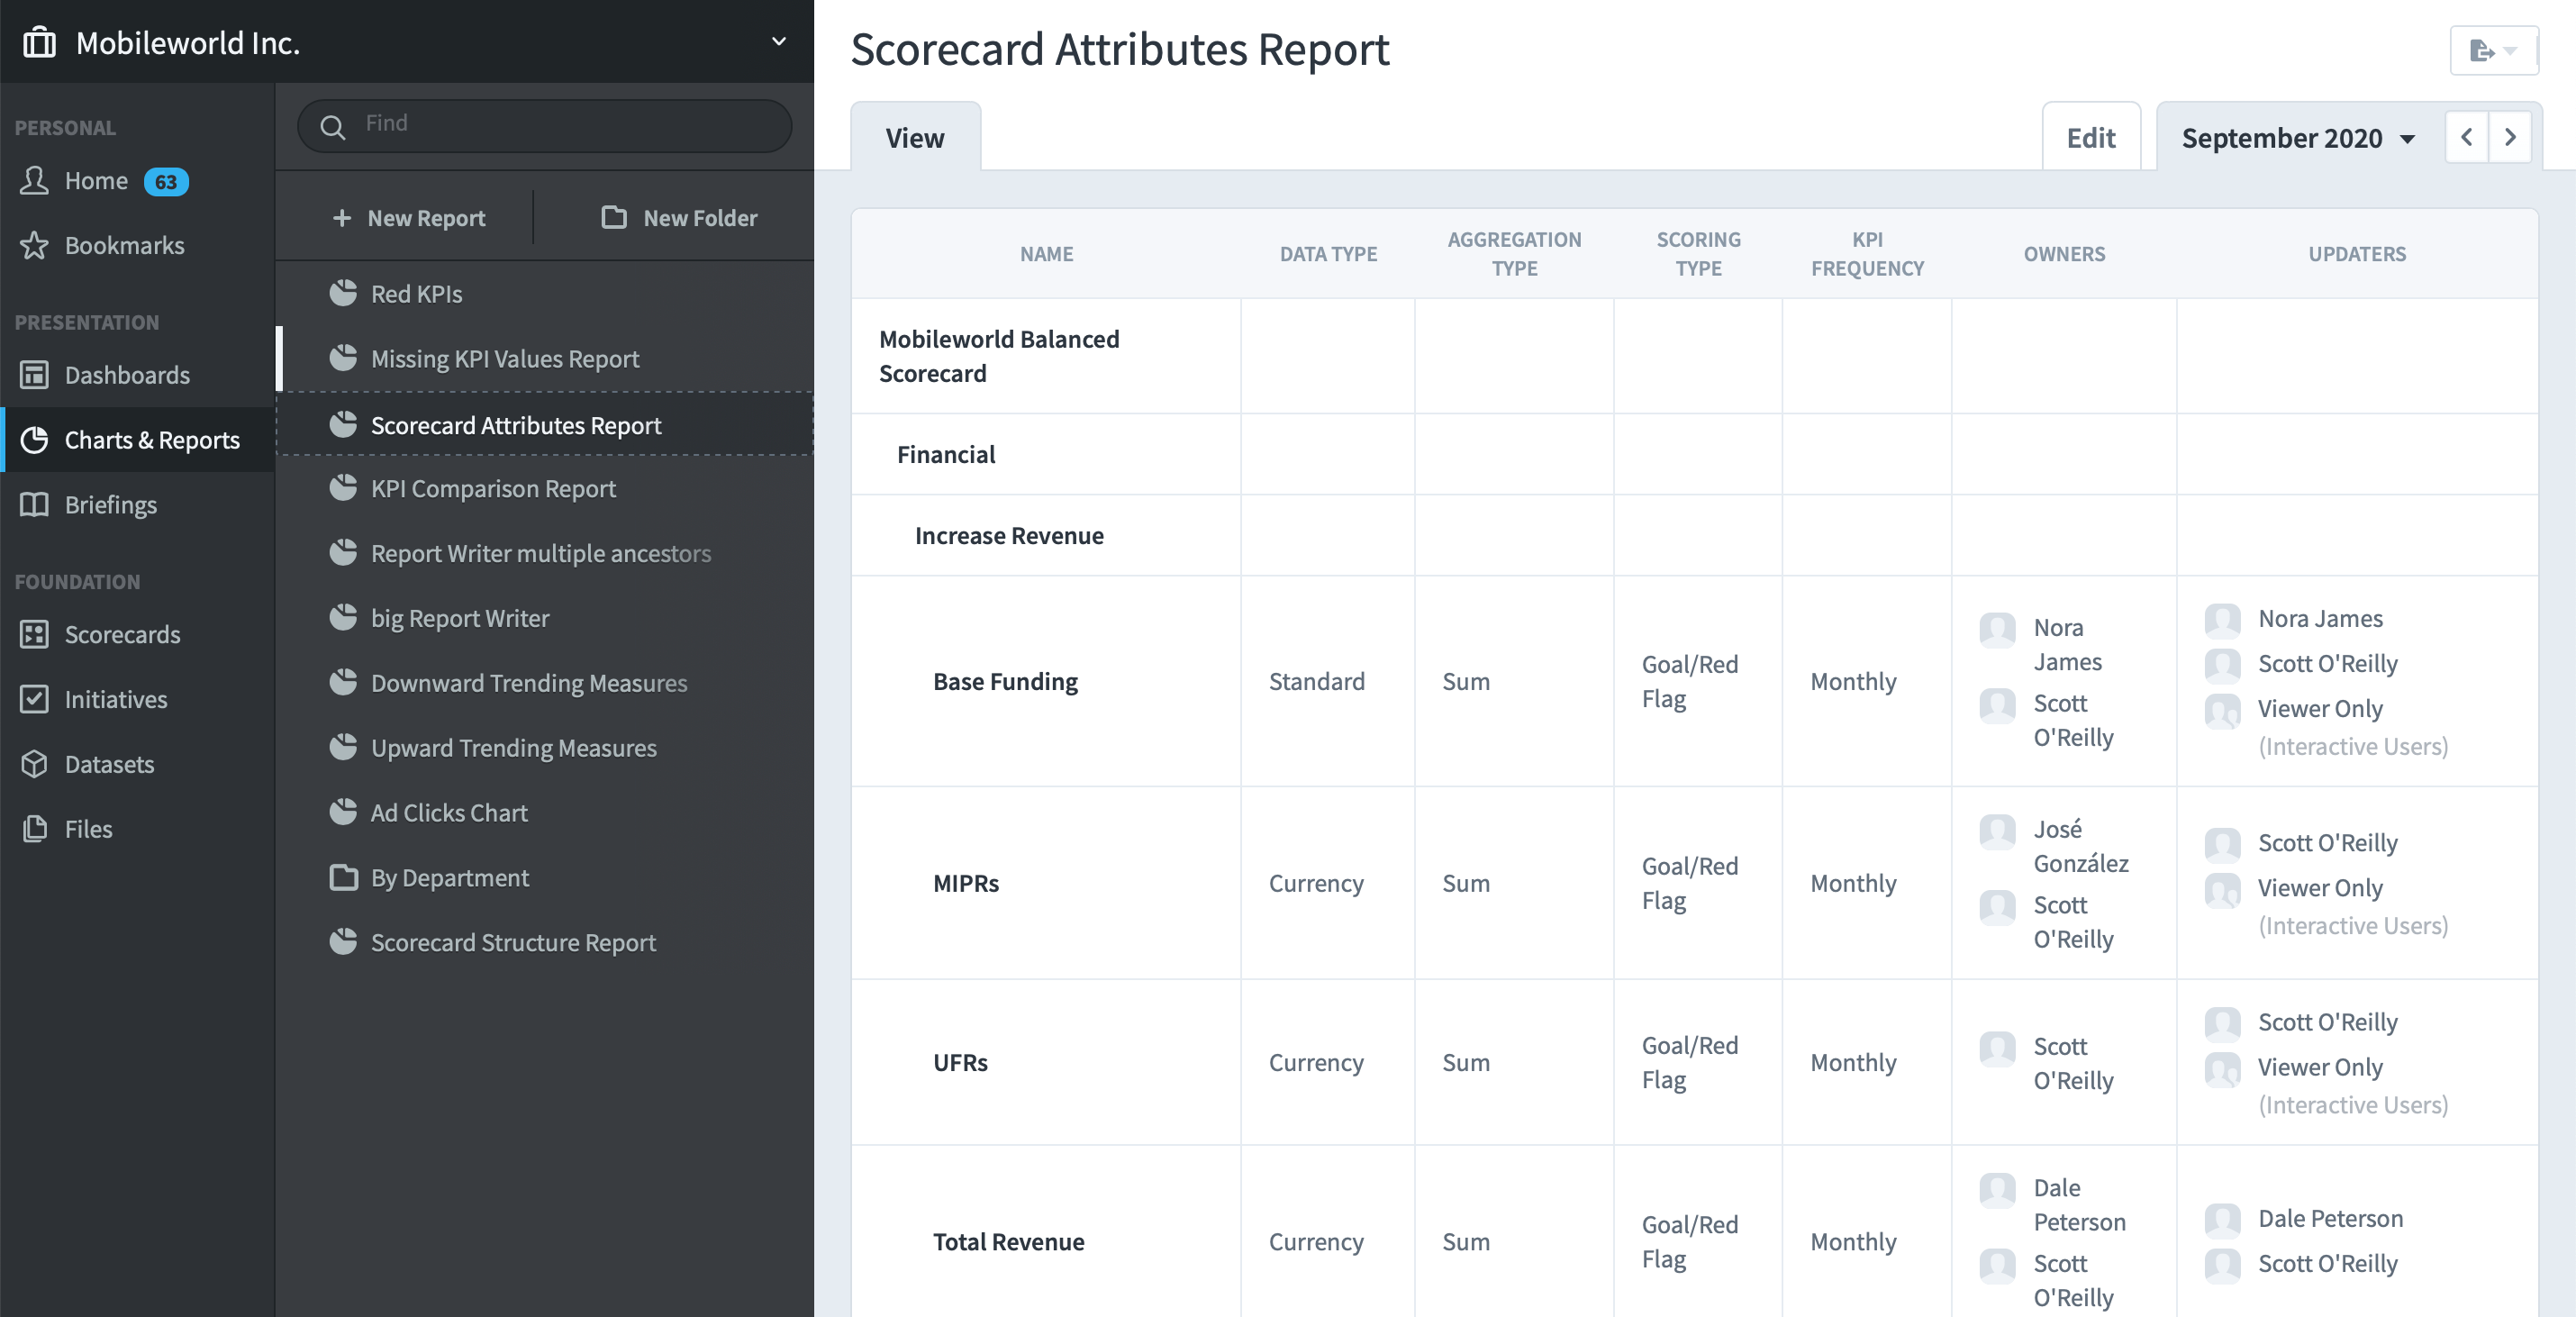
Scorecard Attributes Report
The Scorecard Attributes Report doesn't show any performance information. Instead, it shows you information like the owners, updaters, and KPI frequency of multiple scorecard items at once. To run the report, all you have to do is choose a scorecard item. Here we've selected the entire Mobileworld scorecard.
When we click Finish, we see a report that looks like this: